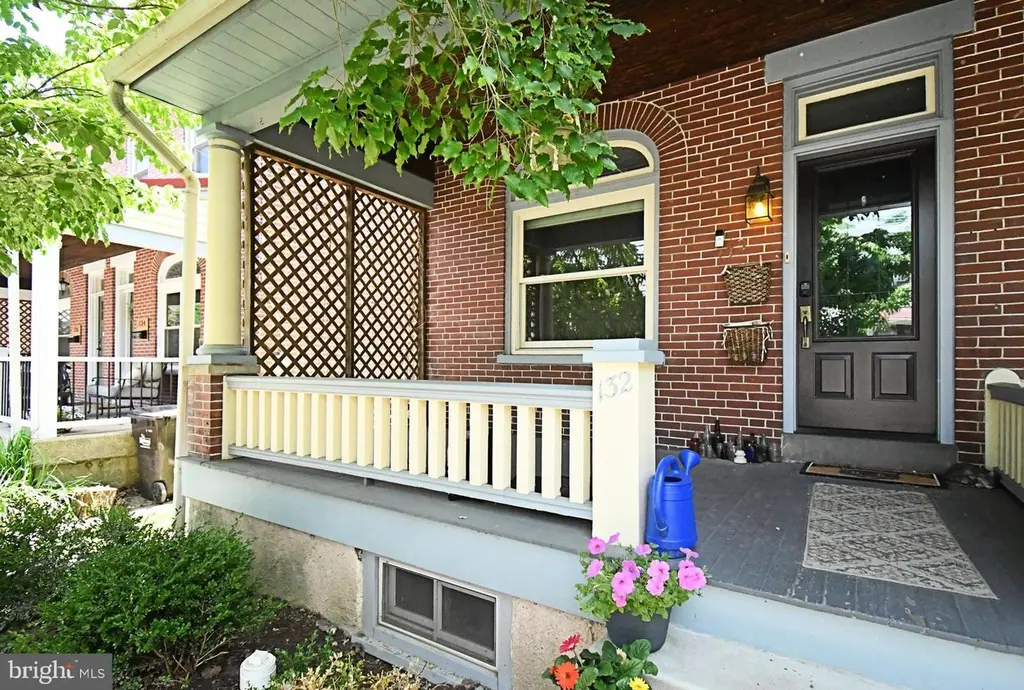
132 Walnut St
Mont Clare, PA 19453
$440,000C
3 bd · 2.0 ba ·
1,562 sqft ·
Built 1910
· MultiFamily
· Active
· 12 DOM
Cashflow @ list (25.0% down · 7.5%)
Estimated rent
$4,087/mo
Mortgage (P&I)
−$2,307
Tax + insurance
−$893
HOA
−$0
Vac / Maint / Mgmt
−$858
Net cashflow
$28/mo
Annual
$338/yr
Cap rate
7.63%
Cash-on-cash
4.76%
DSCR
1.21
1% rule
0.93%
Cash to close
$123,200
Investor read
- This is a 2 × 2-bed/1.0-bath units multifamily listed at $440k.
- At list price, monthly cash flow is $28 ($338/yr) — positive. Per door: $14/mo.
- The deal already cash-flows at list — no discount required.
- To meet the 1% rule (rent ≥ 1% of price), the offer needs to be $409k (7.1% below list).
- Only 12 days on market — expect competitive offers; lowballing is unlikely to land.
- Recommended offer: $409k (7.1% below list) — sets the bar for 1% rule.
- Local home prices are declining (-3.0%/yr); year-one equity from $3k of loan paydown is wiped out by about $13k of value loss. Plan a longer hold.
- Location reads: area grade C — affects rentability + tenant quality, not the cash-flow math above.
- Spring-Ford Area SD (suburban): math 58% / reading 78% proficiency, ranked #23 of 539 in PA (top 4%) — acceptable for families but not a draw, mixed tenant base, ~2y average lease; only 11% free/reduced lunch — higher-income household profile.
- Watch-outs: flood insurance adds $460/mo; built in 1910 — expect roof / HVAC / electrical / plumbing capex.
- Market conditions: 6 active listings in the ZIP; 23 comparable units currently listed for rent nearby; rentals at typical pace (median 17d on market — plan ~3-4 weeks tenant-placement turnaround); 1,936 units permitted in Montgomery County in 2024 (530 in 5+ unit buildings).
- Montgomery County population projected at +5% by 2050 — modest demand growth; plan on rents tracking national, not racing it.
- 3 sale attempts since 3y ago with the ask held roughly flat each time — persistent listings suggest the price (not the market) is what's stuck; bring a comps-based counter.
- Climate carrying-cost: in FEMA flood zone AE (mandatory federal flood insurance); major wind risk, 27% chance of damaging wind over 30y; extreme-heat days projected 7→15/yr by 2055 (HVAC capex compounding) — expect insurance premiums to compound above CPI over the hold.
- Cap rate 7.6% vs local median 2.1% in Mont Clare — top-decile yield for the area; either an underpriced asset or a hidden risk that comps aren't pricing in. Stress-test before assuming the spread holds.
Questions for listing agent
- Can we see the unit-by-unit rent roll, current vacancy, and any below-market leases? What's the average tenancy length?
- What capital expenditures (roof, boiler, parking lot, exteriors) have been made in the last 5 years, and what's planned in the next 2?
- Built in 1910 — when were the roof, HVAC, electrical panel, plumbing, and water heater last replaced?
- What's the actual annual flood-insurance premium (NFIP or private), and is the property in a SFHA with mandatory coverage?
- Is there a deadline driving the sale (1031 exchange, divorce, estate, relocation)? That informs how much negotiation room exists.
- What's the average days-on-market for RENTAL listings here right now (not sales)? A rising rental-DOM trend means longer vacancies and softer asking-rent achievability than the comps imply.
- What's the recent tenant-quality profile in this submarket — average credit score on applications, eviction rate, late-payment / NSF rate, and stable-employment percentage? A property-management company in the area should have these aggregated.
- How much new apartment / multifamily construction is in the pipeline within 1–3 miles? Heavy new supply (>2% of stock underway) typically softens rents 12–24 months out; light construction supports rent growth.
CashFlowRE · CFR-QPZT4GAZNZJCEM
· Data 2 days ago
cashflowre.app · 2026-05-29