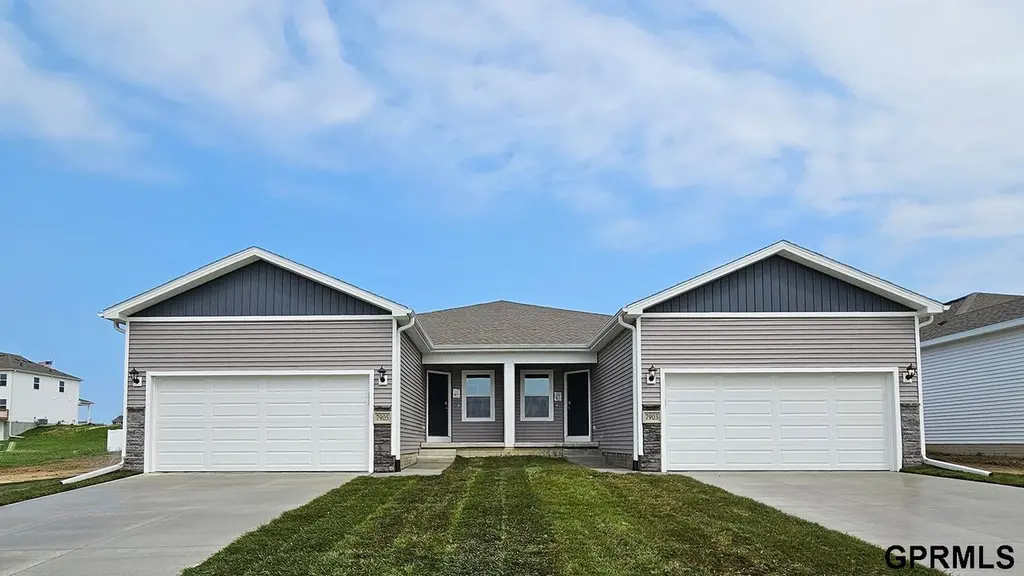
7917 N 170 St
Omaha, NE 68007
$329,990D
4 bd · 3.0 ba ·
2,199 sqft ·
Built 2026
· Other
· Active
· 86 DOM
Cashflow @ list (25.0% down · 7.5%)
Estimated rent
$2,745/mo
Mortgage (P&I)
−$1,731
Tax + insurance
−$550
HOA
−$56
Vac / Maint / Mgmt
−$576
Net cashflow
$-168/mo
Annual
$-2,020/yr
Cap rate
5.68%
Cash-on-cash
-2.19%
DSCR
0.90
1% rule
0.83%
Cash to close
$92,397
Investor read
- This is a 4-bed/3.0-bath other listed at $330k. Condition is rated excellent.
- At list price, monthly cash flow is $-168 ($-2k/yr) — negative.
- To cash-flow at today's rent, offer at most $306k (7.4% below list).
- To meet the 1% rule (rent ≥ 1% of price), the offer needs to be $274k (16.8% below list).
- It's been on market 86 days — a 6% lower offer ($310k) is reasonable based on typical stale-listing flexibility.
- Recommended offer: $274k (16.8% below list) — sets the bar for 1% rule.
- Local home prices are declining (-3.0%/yr); year-one equity from $2k of loan paydown is wiped out by about $10k of value loss. Plan a longer hold.
- Location reads 84/100 on livability (#7 in NE, #663 nationally) — a professional / high-income tenant draw. Strengths: amenities A+, commute A+, cost of living A+; Watch: crime F.
- Bennington Public Schools (rural): math 67% / reading 67% proficiency, ranked #3 of 111 in NE (top 3%) — acceptable for families but not a draw, mixed tenant base, ~2y average lease; only 6% free/reduced lunch — higher-income household profile.
- Zoned schools: Pine Creek Elementary (math 77% / reading 74%, grade A, #18 of 502 statewide, top 3%, 578 students, 8% FRL); Bennington High School (math 66% / reading 70%, grade B, #21 of 261 statewide, top 8%, 1,002 students, 14% FRL) — zoned schools at 11% FRL track the district average.
- Market conditions: Rents rising fast (+5.9%/yr); 464 active listings in the ZIP; 5 comparable units currently listed for rent nearby; rentals leasing fast (median 4d on market — plan ~1-2 weeks tenant-placement turnaround); high-income renter base; 4,539 units permitted in Douglas County in 2024 (2,583 in 5+ unit buildings).
- Douglas County population projected at +28% by 2050 — long-run rental-demand tailwind backs the buy-and-hold thesis.
- 3 sale attempts with the ask held roughly flat each time — persistent listings suggest the price (not the market) is what's stuck; bring a comps-based counter.
- Cap rate 5.7% vs local median 3.6% in Omaha — top-decile yield for the area; either an underpriced asset or a hidden risk that comps aren't pricing in. Stress-test before assuming the spread holds.
Questions for listing agent
- What do current leases actually rent for vs. the listed asking? Can we see a recent rent roll and the last 12 months of T-12 income?
- It's been on market 86 days. Have you received any prior offers? Is the seller open to a 17% concession, seller financing, or rate buy-down credit?
- What does the HOA fee cover, when was the last increase, and are there any pending special assessments or reserve-fund shortfalls?
- Why hasn't it sold? Are there any deal-killer items the seller is aware of (foundation, flood, title, zoning, code violations)?
- Is there a deadline driving the sale (1031 exchange, divorce, estate, relocation)? That informs how much negotiation room exists.
- Crime grade is F in this area — have there been break-ins, vandalism, or insurance claims at this property in the last 3 years? What carrier currently insures it and at what premium?
- The area grade is low — what's the realistic commute time and amenity access for the typical tenant pool here? Any planned neighborhood developments (good or bad) we should know about?
- What's the average days-on-market for RENTAL listings here right now (not sales)? A rising rental-DOM trend means longer vacancies and softer asking-rent achievability than the comps imply.
CashFlowRE · CFR-QQACQSBEXJFMS1
· Data 9 h ago
cashflowre.app · 2026-05-29