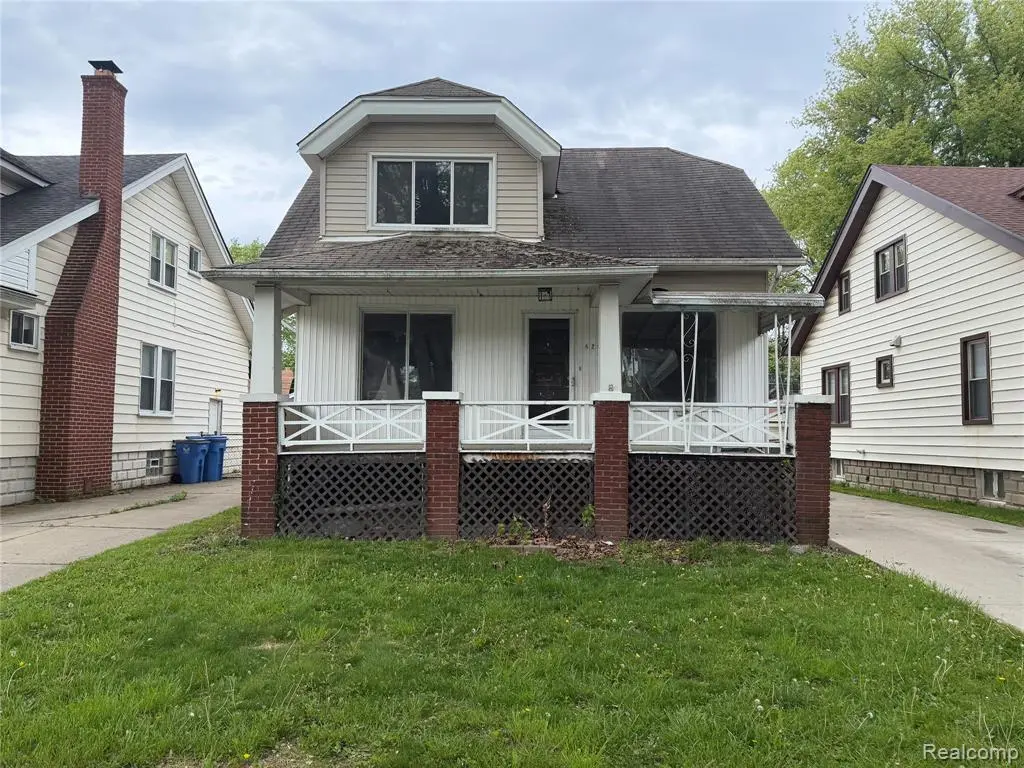
4204 Hipp St
Dearborn Heights, MI 48125
$124,900B
4 bd · 1.0 ba ·
1,296 sqft ·
Built 1925
· SingleFamily
· Pending
· 6 DOM
Cashflow @ list (25.0% down · 7.5%)
Estimated rent
$1,804/mo
Mortgage (P&I)
−$655
Tax + insurance
−$832
HOA
−$0
Vac / Maint / Mgmt
−$379
Net cashflow
$-61/mo
Annual
$-736/yr
Cap rate
10.13%
Cash-on-cash
13.69%
DSCR
1.61
1% rule
1.44%
Cash to close
$34,972
Investor read
- This is a 4-bed/1.0-bath single-family listed at $125k.
- At list price, monthly cash flow is $-61 ($-736/yr) — negative.
- To cash-flow at today's rent, offer at most $114k (8.7% below list).
- Meets the 1% rule at list price ($2k rent vs $125k).
- Only 6 days on market — expect competitive offers; lowballing is unlikely to land.
- Recommended offer: $114k (8.7% below list) — sets the bar for cash-flow.
- Local home prices are declining (-3.0%/yr); year-one equity from $864 of loan paydown is wiped out by about $4k of value loss. Plan a longer hold.
- Location reads 79/100 on livability (#82 in MI, #1,885 nationally) — a middle-class / working-renter tenant base. Strengths: commute A+, cost of living A+, housing A+; Watch: schools C-, crime D+, employment D+.
- Dearborn Heights School District #7 (suburban): math 13% / reading 26% proficiency, ranked #466 of 540 in MI (top 86%) — low school quality limits family demand, transient renter base, plan for 1-2y turnover; 60% free/reduced lunch — lower-income household profile, screen leases tightly.
- Watch-outs: property tax is 3.1% of price; flood insurance adds $460/mo; built in 1925 — expect roof / HVAC / electrical / plumbing capex.
- Market conditions: Rents rising (+2.0%/yr); 137 active listings in the ZIP; 16 comparable units currently listed for rent nearby; rentals leasing fast (median 11d on market — plan ~1-2 weeks tenant-placement turnaround); 2,639 units permitted in Wayne County in 2024 (1,216 in 5+ unit buildings).
- Wayne County population projected at -17% by 2050 — secular population decline; favor cash flow + early exit over multi-decade hold.
- 4 sale attempts since 15y ago with the ask held roughly flat each time — persistent listings suggest the price (not the market) is what's stuck; bring a comps-based counter.
- Current owner paid $25k; list at $125k implies a 400% gain — meaningful room to come down on a strong offer.
- Climate carrying-cost: in FEMA flood zone AE (mandatory federal flood insurance) — expect insurance premiums to compound above CPI over the hold.
- Cap rate 10.1% vs local median 5.5% in Dearborn Heights — top-decile yield for the area; either an underpriced asset or a hidden risk that comps aren't pricing in. Stress-test before assuming the spread holds.
- This rent runs 36% of the median local income ($60k/yr) — at the standard rent-burdened threshold; future hikes will face affordability resistance.
Questions for listing agent
- What do current leases actually rent for vs. the listed asking? Can we see a recent rent roll and the last 12 months of T-12 income?
- Built in 1925 — when were the roof, HVAC, electrical panel, plumbing, and water heater last replaced?
- Property tax is high relative to price — has the assessment been appealed recently, and will the sale trigger a re-assessment?
- What's the actual annual flood-insurance premium (NFIP or private), and is the property in a SFHA with mandatory coverage?
- Is there a deadline driving the sale (1031 exchange, divorce, estate, relocation)? That informs how much negotiation room exists.
- Crime grade is D in this area — have there been break-ins, vandalism, or insurance claims at this property in the last 3 years? What carrier currently insures it and at what premium?
- What's the average days-on-market for RENTAL listings here right now (not sales)? A rising rental-DOM trend means longer vacancies and softer asking-rent achievability than the comps imply.
- What's the recent tenant-quality profile in this submarket — average credit score on applications, eviction rate, late-payment / NSF rate, and stable-employment percentage? A property-management company in the area should have these aggregated.
CashFlowRE · CFR-QR8QW1D4BQDQVC
· Data 3 weeks ago
cashflowre.app · 2026-05-29