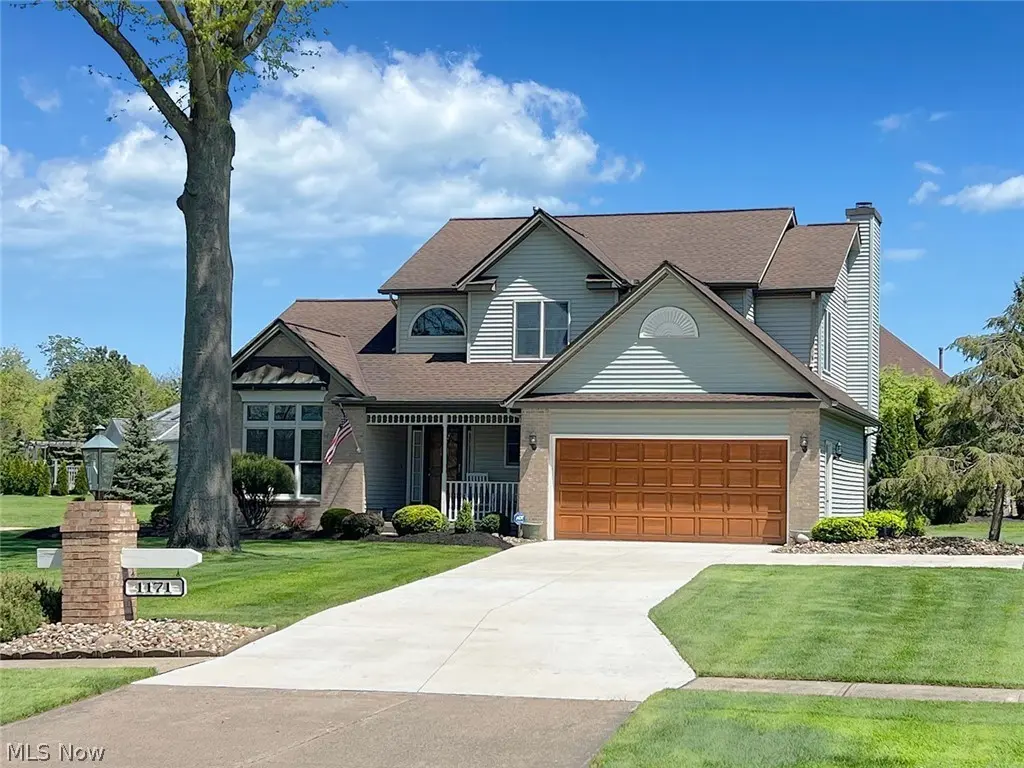
1171 Vermilion Rd
Vermilion, OH 44089
$419,000B-
3 bd · 2.5 ba ·
2,028 sqft ·
Built 1994
· SingleFamily
· Active
· 41 DOM
Cashflow @ list (25.0% down · 7.5%)
Estimated rent
$5,256/mo
Mortgage (P&I)
−$2,197
Tax + insurance
−$598
HOA
−$109
Vac / Maint / Mgmt
−$1,104
Net cashflow
$1,247/mo
Annual
$14,967/yr
Cap rate
9.87%
Cash-on-cash
12.76%
DSCR
1.57
1% rule
1.25%
Cash to close
$117,320
Investor read
- This is a 3-bed/2.5-bath single-family listed at $419k.
- At list price, monthly cash flow is $1k ($15k/yr) — positive.
- The deal already cash-flows at list — no discount required.
- Meets the 1% rule at list price ($5k rent vs $419k).
- It's been on market 41 days — a 3% lower offer ($406k) is reasonable based on typical stale-listing flexibility.
- Recommended offer: $406k (3.0% below list) — sets the bar for market timing.
- Local home prices are declining (-3.0%/yr); year-one equity from $3k of loan paydown is wiped out by about $13k of value loss. Plan a longer hold.
- Location reads 81/100 on livability (#96 in OH, #1,481 nationally) — a professional / high-income tenant draw. Strengths: crime A+, cost of living A+, housing A+; Watch: commute F.
- Firelands Local (rural): math 65% / reading 67% proficiency, ranked #180 of 656 in OH (top 27%) — acceptable for families but not a draw, mixed tenant base, ~2y average lease.
- Zoned schools: Firelands Elementary School (math 72% / reading 68%, grade A-, #380 of 1,584 statewide, top 25%, 783 students, 35% FRL); Firelands Middle School (math 63% / reading 68%, grade A-, #186 of 654 statewide, top 29%, 414 students, 39% FRL); Firelands High School (math 57% / reading 62%, grade C+, #243 of 781 statewide, top 33%, 487 students, 41% FRL).
- Market conditions: 145 active listings in the ZIP; 2 comparable units currently listed for rent nearby; 1,098 units permitted in Lorain County in 2024 (20 in 5+ unit buildings).
- 4 sale attempts since 31y ago with the ask held roughly flat each time — persistent listings suggest the price (not the market) is what's stuck; bring a comps-based counter.
- Current owner paid $230k; list at $419k implies a 82% gain — meaningful room to come down on a strong offer.
- At projected returns (-3.0% appreciation + 3.0% rent growth), your $117k cash investment doubles in ~9 years — after that, you're playing with house money.
- Cap rate 9.9% vs local median 6.2% in Vermilion — top-decile yield for the area; either an underpriced asset or a hidden risk that comps aren't pricing in. Stress-test before assuming the spread holds.
- At $5,256/mo this rent would consume 88% of the median local household income ($72k/yr) — very limited rent-growth headroom before tenants either downsize or default.
Questions for listing agent
- It's been on market 41 days. Have you received any prior offers? Is the seller open to a 3% concession, seller financing, or rate buy-down credit?
- What does the HOA fee cover, when was the last increase, and are there any pending special assessments or reserve-fund shortfalls?
- Is there a deadline driving the sale (1031 exchange, divorce, estate, relocation)? That informs how much negotiation room exists.
- Schools are B-rated — typically a magnet for longer-tenancy family renters. What's the average tenant stay here, and is there a school-zone premium baked into asking?
- What's the average days-on-market for RENTAL listings here right now (not sales)? A rising rental-DOM trend means longer vacancies and softer asking-rent achievability than the comps imply.
- What's the recent tenant-quality profile in this submarket — average credit score on applications, eviction rate, late-payment / NSF rate, and stable-employment percentage? A property-management company in the area should have these aggregated.
- How much new for-sale + rental construction is in the pipeline within 1–3 miles? Heavy new supply typically softens prices + rents 12–24 months out; constrained supply supports both.
CashFlowRE · CFR-QSQH701KQ135XN
· Data 18 h ago
cashflowre.app · 2026-05-29