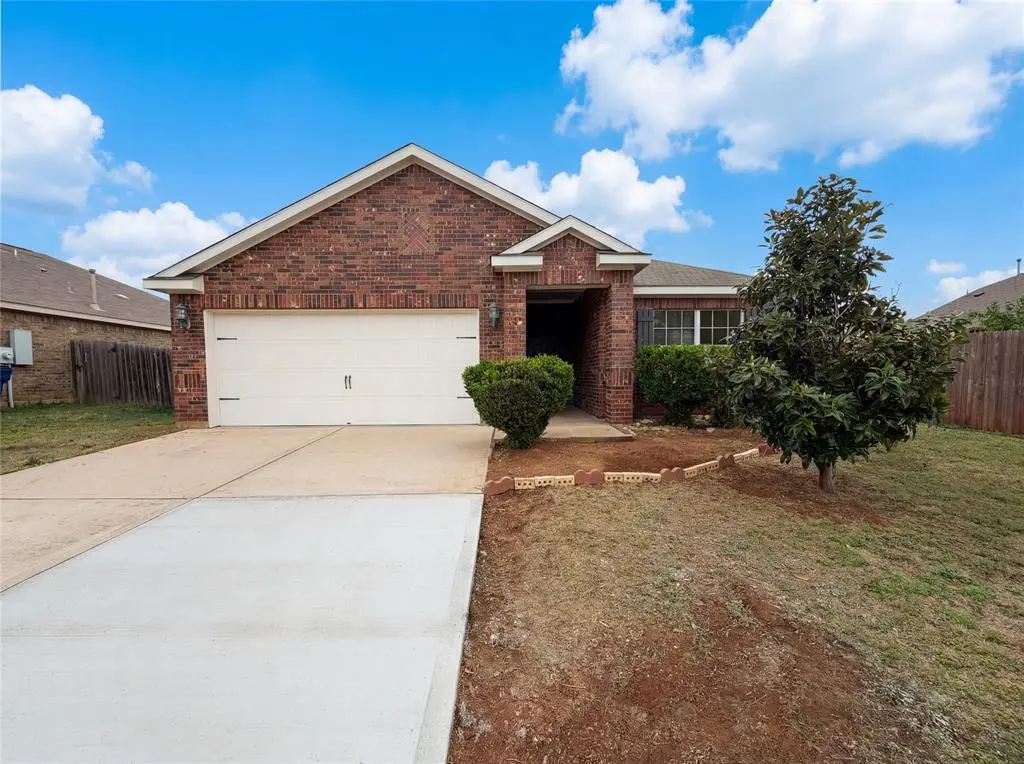
657 Handle Dr
Crowley, TX 76036
$245,000D
3 bd · 2.0 ba ·
1,373 sqft ·
Built 2012
· SingleFamily
· Pending
· 27 DOM
Cashflow @ list (25.0% down · 7.5%)
Estimated rent
$2,106/mo
Mortgage (P&I)
−$1,285
Tax + insurance
−$554
HOA
−$42
Vac / Maint / Mgmt
−$442
Net cashflow
$-217/mo
Annual
$-2,602/yr
Cap rate
5.23%
Cash-on-cash
-3.79%
DSCR
0.83
1% rule
0.86%
Cash to close
$68,600
Investor read
- This is a 3-bed/2.0-bath single-family listed at $245k.
- At list price, monthly cash flow is $-217 ($-3k/yr) — negative.
- To cash-flow at today's rent, offer at most $207k (15.6% below list).
- To meet the 1% rule (rent ≥ 1% of price), the offer needs to be $211k (14.0% below list).
- It's been on market 27 days — a 2% lower offer ($241k) is reasonable based on typical stale-listing flexibility.
- Recommended offer: $207k (15.6% below list) — sets the bar for cash-flow.
- Local home prices are declining (-3.0%/yr); year-one equity from $2k of loan paydown is wiped out by about $7k of value loss. Plan a longer hold.
- Location reads 76/100 on livability (#103 in TX, #3,462 nationally) — a middle-class / working-renter tenant base. Strengths: cost of living A+, housing A+, health & safety A+; Watch: amenities F, commute F.
- Crowley ISD (urban): math 23% / reading 32% proficiency, ranked #643 of 826 in TX (top 78%) — low school quality limits family demand, transient renter base, plan for 1-2y turnover.
- Zoned schools: Bess Race El (math 28% / reading 32%, grade F, #2,500 of 4,322 statewide, top 58%, 665 students, 77% FRL); H F Stevens Middle (math 16% / reading 26%, grade F, #1,387 of 1,662 statewide, top 85%, 747 students, 84% FRL); Crowley H S (math 23% / reading 36%, grade F, #1,112 of 1,632 statewide, top 70%, 2,351 students, 72% FRL) — zoned schools average 78% FRL vs 52% district-wide (26 pts higher); higher-poverty schools than district average — tighter screening recommended.
- Market conditions: Rents rising (+2.3%/yr); 1036 active listings in the ZIP; 40 comparable units currently listed for rent nearby; rentals at typical pace (median 27d on market — plan ~3-4 weeks tenant-placement turnaround); solid renter incomes; 18,938 units permitted in Tarrant County in 2024 (8,336 in 5+ unit buildings).
- Tarrant County population projected at +41% by 2050 — long-run rental-demand tailwind backs the buy-and-hold thesis.
- Climate carrying-cost: extreme-heat days projected 7→26/yr by 2055 (HVAC capex compounding) — expect insurance premiums to compound above CPI over the hold.
Questions for listing agent
- What do current leases actually rent for vs. the listed asking? Can we see a recent rent roll and the last 12 months of T-12 income?
- What does the HOA fee cover, when was the last increase, and are there any pending special assessments or reserve-fund shortfalls?
- Is there a deadline driving the sale (1031 exchange, divorce, estate, relocation)? That informs how much negotiation room exists.
- Schools are D-rated, which usually means shorter tenancies and higher turnover. Who's the typical renter profile here, and what's been the actual vacancy rate?
- The area grade is low — what's the realistic commute time and amenity access for the typical tenant pool here? Any planned neighborhood developments (good or bad) we should know about?
- What's the average days-on-market for RENTAL listings here right now (not sales)? A rising rental-DOM trend means longer vacancies and softer asking-rent achievability than the comps imply.
- What's the recent tenant-quality profile in this submarket — average credit score on applications, eviction rate, late-payment / NSF rate, and stable-employment percentage? A property-management company in the area should have these aggregated.
- How much new for-sale + rental construction is in the pipeline within 1–3 miles? Heavy new supply typically softens prices + rents 12–24 months out; constrained supply supports both.
CashFlowRE · CFR-QVR1FV5PHDJ0ZH
· Data 4 weeks ago
cashflowre.app · 2026-05-29