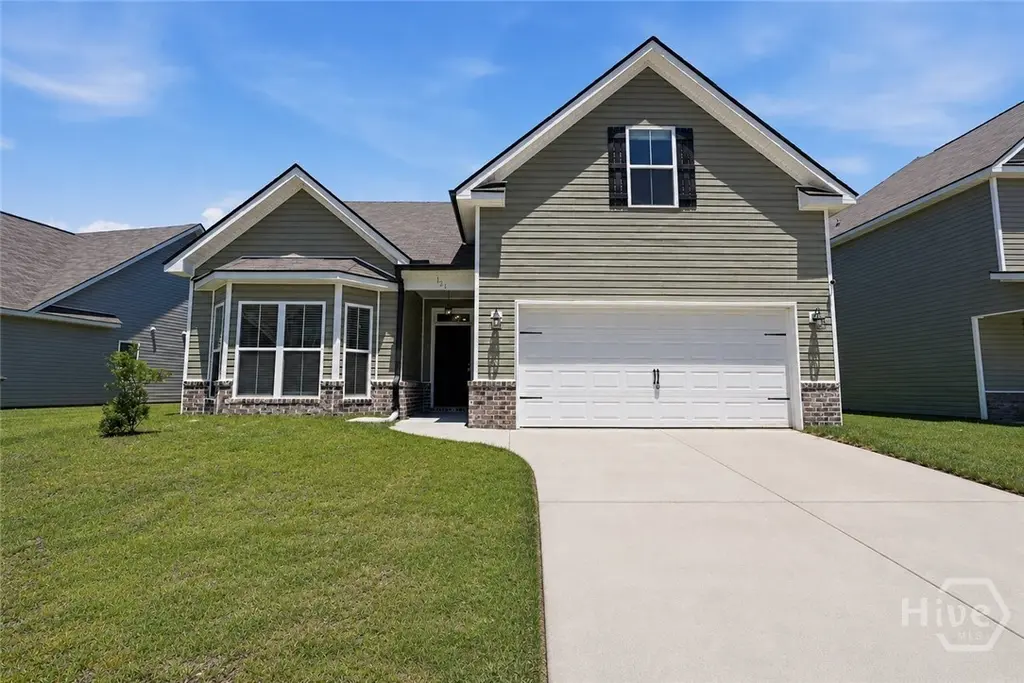
121 Sams Dr
Guyton, GA 31312
$350,000F
3 bd · 3.0 ba ·
2,001 sqft ·
Built 2022
· SingleFamily
· Active
· 16 DOM
Cashflow @ list (25.0% down · 7.5%)
Estimated rent
$2,306/mo
Mortgage (P&I)
−$1,835
Tax + insurance
−$461
HOA
−$33
Vac / Maint / Mgmt
−$484
Net cashflow
$-507/mo
Annual
$-6,086/yr
Cap rate
4.55%
Cash-on-cash
-6.21%
DSCR
0.72
1% rule
0.66%
Cash to close
$98,000
Investor read
- This is a 3-bed/3.0-bath single-family listed at $350k.
- At list price, monthly cash flow is $-507 ($-6k/yr) — negative.
- To cash-flow at today's rent, offer at most $260k (25.6% below list).
- To meet the 1% rule (rent ≥ 1% of price), the offer needs to be $231k (34.1% below list).
- It's been on market 16 days — a 2% lower offer ($345k) is reasonable based on typical stale-listing flexibility.
- Recommended offer: $231k (34.1% below list) — sets the bar for 1% rule.
- Local home prices are declining (-3.0%/yr); year-one equity from $2k of loan paydown is wiped out by about $10k of value loss. Plan a longer hold.
- Location reads 69/100 on livability (#128 in GA) — a middle-class / working-renter tenant base. Strengths: crime A+, cost of living A+, housing A+; Watch: amenities F, commute F, health & safety F.
- Effingham County (rural): math 49% / reading 48% proficiency, ranked #16 of 174 in GA (top 9%) — families likely to look elsewhere, expect single-tenant / working-renter base with shorter leases.
- Zoned schools: Marlow Elementary School (math 63% / reading 50%, grade C+, #159 of 1,228 statewide, top 13%, 775 students, 31% FRL); South Effingham Middle School (math 51% / reading 58%, grade B-, #52 of 470 statewide, top 11%, 1,097 students, 32% FRL); South Effingham High School (math 33% / reading 27%, grade F, #135 of 424 statewide, top 32%, 1,888 students, 30% FRL) — zoned schools at 31% FRL track the district average.
- Market conditions: 400 active listings in the ZIP; 1 comparable units currently listed for rent nearby; solid renter incomes; 836 units permitted in Effingham County in 2024 (46 in 5+ unit buildings).
- Effingham County population projected at +33% by 2050 — long-run rental-demand tailwind backs the buy-and-hold thesis.
- 4 sale attempts since 3y ago; this cycle's ask has dropped $20k (5%) from the opening price — seller is motivated, your offer sets the floor, not the list.
- Climate carrying-cost: severe wind risk, 98% chance of damaging wind over 30y; major wildfire risk; extreme-heat days projected 7→17/yr by 2055 (HVAC capex compounding) — expect insurance premiums to compound above CPI over the hold.
Questions for listing agent
- What do current leases actually rent for vs. the listed asking? Can we see a recent rent roll and the last 12 months of T-12 income?
- What does the HOA fee cover, when was the last increase, and are there any pending special assessments or reserve-fund shortfalls?
- Is there a deadline driving the sale (1031 exchange, divorce, estate, relocation)? That informs how much negotiation room exists.
- The area grade is low — what's the realistic commute time and amenity access for the typical tenant pool here? Any planned neighborhood developments (good or bad) we should know about?
- What's the average days-on-market for RENTAL listings here right now (not sales)? A rising rental-DOM trend means longer vacancies and softer asking-rent achievability than the comps imply.
- What's the recent tenant-quality profile in this submarket — average credit score on applications, eviction rate, late-payment / NSF rate, and stable-employment percentage? A property-management company in the area should have these aggregated.
- How much new for-sale + rental construction is in the pipeline within 1–3 miles? Heavy new supply typically softens prices + rents 12–24 months out; constrained supply supports both.
CashFlowRE · CFR-QW7HT2CH6H16PQ
· Data 13 h ago
cashflowre.app · 2026-05-29