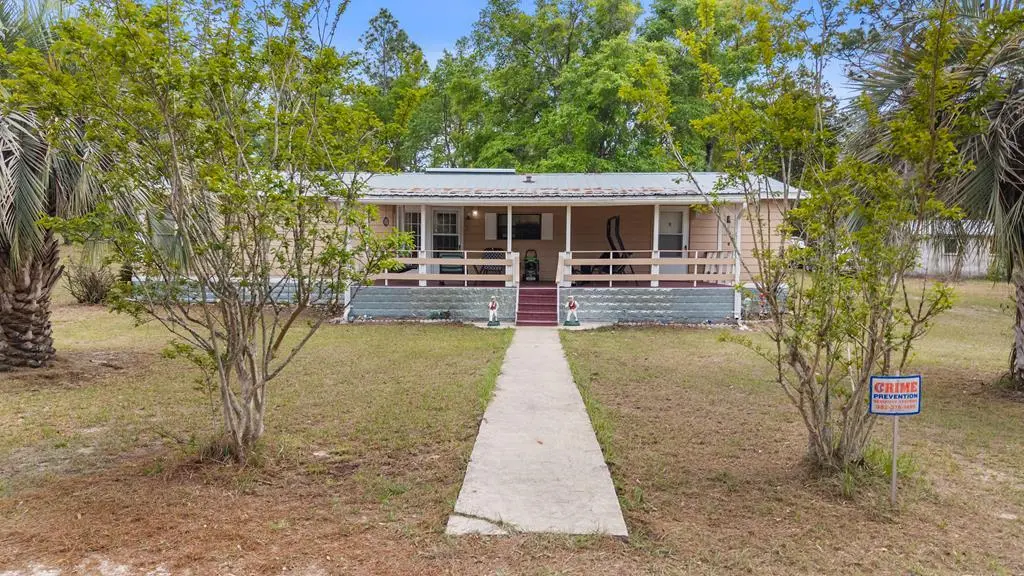
2649 NW County Road 340
Bell, FL 32619
$249,000C
2 bd · 2.0 ba ·
1,680 sqft ·
Built 1986
· Manufactured
· Active
· 75 DOM
Cashflow @ list (25.0% down · 7.5%)
Estimated rent
$1,905/mo
Mortgage (P&I)
−$1,306
Tax + insurance
−$278
HOA
−$0
Vac / Maint / Mgmt
−$400
Net cashflow
$-79/mo
Annual
$-948/yr
Cap rate
5.91%
Cash-on-cash
-1.36%
DSCR
0.94
1% rule
0.77%
Cash to close
$69,720
Investor read
- This is a 2-bed/2.0-bath manufactured listed at $249k.
- At list price, monthly cash flow is $-79 ($-948/yr) — negative.
- To cash-flow at today's rent, offer at most $235k (5.6% below list).
- To meet the 1% rule (rent ≥ 1% of price), the offer needs to be $191k (23.5% below list).
- It's been on market 75 days — a 6% lower offer ($234k) is reasonable based on typical stale-listing flexibility.
- Recommended offer: $191k (23.5% below list) — sets the bar for 1% rule.
- In year one you build about $27k of equity ($2k loan paydown + $25k appreciation (10.0% local appreciation)).
- Location reads 62/100 on livability (#767 in FL) — a middle-class / working-renter tenant base. Strengths: cost of living A+, housing A+; Watch: crime D, health & safety D, amenities F.
- Gilchrist (rural): math 66% / reading 61% proficiency, ranked #9 of 73 in FL (top 12%) — acceptable for families but not a draw, mixed tenant base, ~2y average lease.
- Market conditions: 112 active listings in the ZIP; 94 units permitted in Gilchrist County in 2024 (0 in 5+ unit buildings).
- Gilchrist County population projected to shrink 6% by 2050 — rents likely to lag national; underwrite the cash flow, not the appreciation.
- At projected returns (10.0% appreciation + 3.0% rent growth), your $70k cash investment doubles in ~3 years — after that, you're playing with house money.
- By year 2, paydown + projected appreciation supports a ~$43k cash-out refi (75% LTV) — recoverable capital for the next deal without selling this one.
- Climate carrying-cost: severe wind risk, 99% chance of damaging wind over 30y; major wildfire risk; extreme-heat days projected 7→21/yr by 2055 (HVAC capex compounding) — expect insurance premiums to compound above CPI over the hold.
- Cap rate 5.9% vs local median 4.8% in Bell — meaningfully above typical; check what's discounted (condition, days-on-market, listing class) to confirm the premium yield is real.
Questions for listing agent
- What do current leases actually rent for vs. the listed asking? Can we see a recent rent roll and the last 12 months of T-12 income?
- It's been on market 75 days. Have you received any prior offers? Is the seller open to a 23% concession, seller financing, or rate buy-down credit?
- Why hasn't it sold? Are there any deal-killer items the seller is aware of (foundation, flood, title, zoning, code violations)?
- Is there a deadline driving the sale (1031 exchange, divorce, estate, relocation)? That informs how much negotiation room exists.
- Crime grade is D in this area — have there been break-ins, vandalism, or insurance claims at this property in the last 3 years? What carrier currently insures it and at what premium?
- What's the average days-on-market for RENTAL listings here right now (not sales)? A rising rental-DOM trend means longer vacancies and softer asking-rent achievability than the comps imply.
- What's the recent tenant-quality profile in this submarket — average credit score on applications, eviction rate, late-payment / NSF rate, and stable-employment percentage? A property-management company in the area should have these aggregated.
- How much new for-sale + rental construction is in the pipeline within 1–3 miles? Heavy new supply typically softens prices + rents 12–24 months out; constrained supply supports both.
CashFlowRE · CFR-QWNMCP4QCZNADM
· Data 2 days ago
cashflowre.app · 2026-05-29