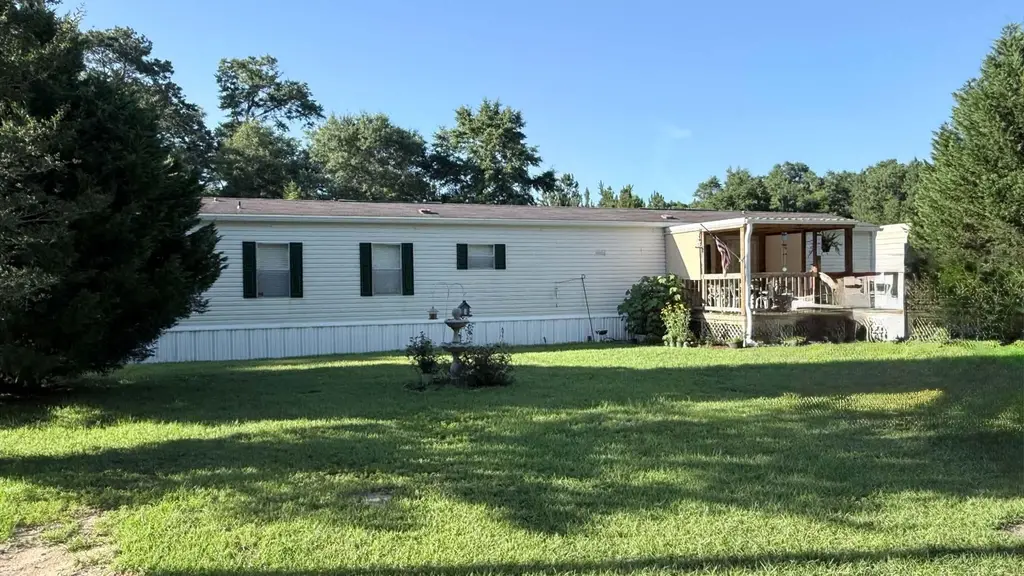
54 Cannon Dr
Paxton, FL 32538
$160,000F
3 bd · 2.0 ba ·
1,140 sqft ·
Built 2007
· Manufactured
· Pending
· 2 DOM
Cashflow @ list (25.0% down · 7.5%)
Estimated rent
$910/mo
Mortgage (P&I)
−$839
Tax + insurance
−$267
HOA
−$0
Vac / Maint / Mgmt
−$191
Net cashflow
$-387/mo
Annual
$-4,642/yr
Cap rate
3.39%
Cash-on-cash
-10.36%
DSCR
0.54
1% rule
0.57%
Cash to close
$44,800
Investor read
- This is a 3-bed/2.0-bath manufactured listed at $160k.
- At list price, monthly cash flow is $-387 ($-5k/yr) — negative.
- To cash-flow at today's rent, offer at most $104k (35.0% below list).
- To meet the 1% rule (rent ≥ 1% of price), the offer needs to be $91k (43.1% below list).
- Only 2 days on market — expect competitive offers; lowballing is unlikely to land.
- Recommended offer: $91k (43.1% below list) — sets the bar for 1% rule.
- In year one you build about $6k of equity ($1k loan paydown + $5k appreciation (3.0% local appreciation)).
- Location reads 57/100 on livability (#861 in FL) — a working-class tenant base; expect higher turnover. Strengths: cost of living A+, housing A+; Watch: crime C-, health & safety C-, amenities F.
- Walton (rural): math 62% / reading 61% proficiency, ranked #10 of 73 in FL (top 14%) — acceptable for families but not a draw, mixed tenant base, ~2y average lease.
- Zoned schools: Freeport Elementary School (math 50% / reading 57%, grade C, #949 of 2,144 statewide, top 45%, 1,123 students, 55% FRL); Emerald Coast Middle School (math 70% / reading 65%, grade A-, #77 of 571 statewide, top 14%, 868 students, 24% FRL); South Walton High School (math 61% / reading 73%, grade B, #69 of 667 statewide, top 11%, 1,235 students, 20% FRL) — zoned schools average 33% FRL vs 48% district-wide (15 pts lower); this property's tenant base skews higher-income than the district average.
- Market conditions: 5 active listings in the ZIP; 2,883 units permitted in Walton County in 2024 (1,322 in 5+ unit buildings).
- Walton County population projected at +46% by 2050 — long-run rental-demand tailwind backs the buy-and-hold thesis.
- 3 sale attempts since 16y ago with the ask held roughly flat each time — persistent listings suggest the price (not the market) is what's stuck; bring a comps-based counter.
- By year 6, paydown + projected appreciation supports a ~$31k cash-out refi (75% LTV) — recoverable capital for the next deal without selling this one.
Questions for listing agent
- What do current leases actually rent for vs. the listed asking? Can we see a recent rent roll and the last 12 months of T-12 income?
- Is there a deadline driving the sale (1031 exchange, divorce, estate, relocation)? That informs how much negotiation room exists.
- The area grade is low — what's the realistic commute time and amenity access for the typical tenant pool here? Any planned neighborhood developments (good or bad) we should know about?
- What's the average days-on-market for RENTAL listings here right now (not sales)? A rising rental-DOM trend means longer vacancies and softer asking-rent achievability than the comps imply.
- What's the recent tenant-quality profile in this submarket — average credit score on applications, eviction rate, late-payment / NSF rate, and stable-employment percentage? A property-management company in the area should have these aggregated.
- How much new for-sale + rental construction is in the pipeline within 1–3 miles? Heavy new supply typically softens prices + rents 12–24 months out; constrained supply supports both.
CashFlowRE · CFR-QYEBGGCDTYTSV5
· Data 2 weeks ago
cashflowre.app · 2026-05-29