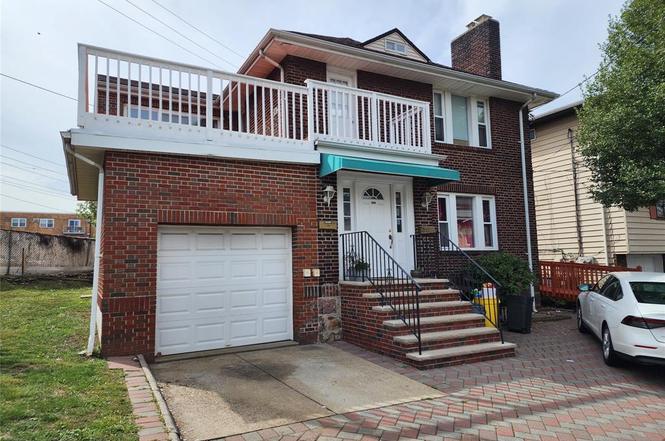
50 Columbia Ave
Palisades Park, NJ 07650
$1,150,000D
8 bd · 5.0 ba ·
— sqft ·
Built —
· MultiFamily
· Active
· 223 DOM
Cashflow @ list (25.0% down · 7.5%)
Estimated rent
$8,646/mo
Mortgage (P&I)
−$6,031
Tax + insurance
−$1,917
HOA
−$0
Vac / Maint / Mgmt
−$1,816
Net cashflow
$-1,117/mo
Annual
$-13,405/yr
Cap rate
5.13%
Cash-on-cash
-4.16%
DSCR
0.81
1% rule
0.75%
Cash to close
$322,000
Investor read
- This is a 2 × 4-bed/2.5-bath units multifamily listed at $1.15M.
- At list price, monthly cash flow is $-1k ($-13k/yr) — negative. Per door: $-559/mo.
- To cash-flow at today's rent, offer at most $988k (14.1% below list).
- To meet the 1% rule (rent ≥ 1% of price), the offer needs to be $865k (24.8% below list).
- It's been on market 223 days — a 12% lower offer ($1.01M) is reasonable based on typical stale-listing flexibility.
- Recommended offer: $865k (24.8% below list) — sets the bar for 1% rule.
- In year one you build about $123k of equity ($8k loan paydown + $115k appreciation (10.0% local appreciation)).
- Location reads 82/100 on livability (#48 in NJ, #1,217 nationally) — a professional / high-income tenant draw. Strengths: crime A+, amenities A+, commute A+; Watch: cost of living F.
- Palisades Park School District (suburban): math 18% / reading 37% proficiency, ranked #360 of 472 in NJ (top 76%) — low school quality limits family demand, transient renter base, plan for 1-2y turnover.
- Zoned schools: Lindbergh Elementary School (math 20% / reading 35%, grade F, #789 of 1,303 statewide, top 61%, 769 students, 59% FRL); Palisades Park Jr-Sr High School (math 16% / reading 40%, grade F, #304 of 399 statewide, top 77%, 745 students, 44% FRL) — zoned schools average 52% FRL vs 32% district-wide (19 pts higher); higher-poverty schools than district average — tighter screening recommended.
- Market conditions: 38 active listings in the ZIP; solid renter incomes; 3,488 units permitted in Bergen County in 2024 (1,610 in 5+ unit buildings).
- Bergen County population projected at +20% by 2050 — long-run rental-demand tailwind backs the buy-and-hold thesis.
- 4 sale attempts since 11y ago with the ask held roughly flat each time — persistent listings suggest the price (not the market) is what's stuck; bring a comps-based counter.
- Current owner paid $515k; list at $1.15M implies a 123% gain — meaningful room to come down on a strong offer.
- By year 2, paydown + projected appreciation supports a ~$198k cash-out refi (75% LTV) — recoverable capital for the next deal without selling this one.
- At $8,646/mo this rent would consume 110% of the median local household income ($95k/yr) (locally 1235% of renters already pay >50% of income on rent) — very limited rent-growth headroom before tenants either downsize or default.
Questions for listing agent
- What do current leases actually rent for vs. the listed asking? Can we see a recent rent roll and the last 12 months of T-12 income?
- It's been on market 223 days. Have you received any prior offers? Is the seller open to a 25% concession, seller financing, or rate buy-down credit?
- Can we see the unit-by-unit rent roll, current vacancy, and any below-market leases? What's the average tenancy length?
- What capital expenditures (roof, boiler, parking lot, exteriors) have been made in the last 5 years, and what's planned in the next 2?
- Why hasn't it sold? Are there any deal-killer items the seller is aware of (foundation, flood, title, zoning, code violations)?
- Is there a deadline driving the sale (1031 exchange, divorce, estate, relocation)? That informs how much negotiation room exists.
- The area grade is low — what's the realistic commute time and amenity access for the typical tenant pool here? Any planned neighborhood developments (good or bad) we should know about?
- What's the average days-on-market for RENTAL listings here right now (not sales)? A rising rental-DOM trend means longer vacancies and softer asking-rent achievability than the comps imply.
CashFlowRE · CFR-R0AZW20F30CK05
· Data 1 day ago
cashflowre.app · 2026-05-29