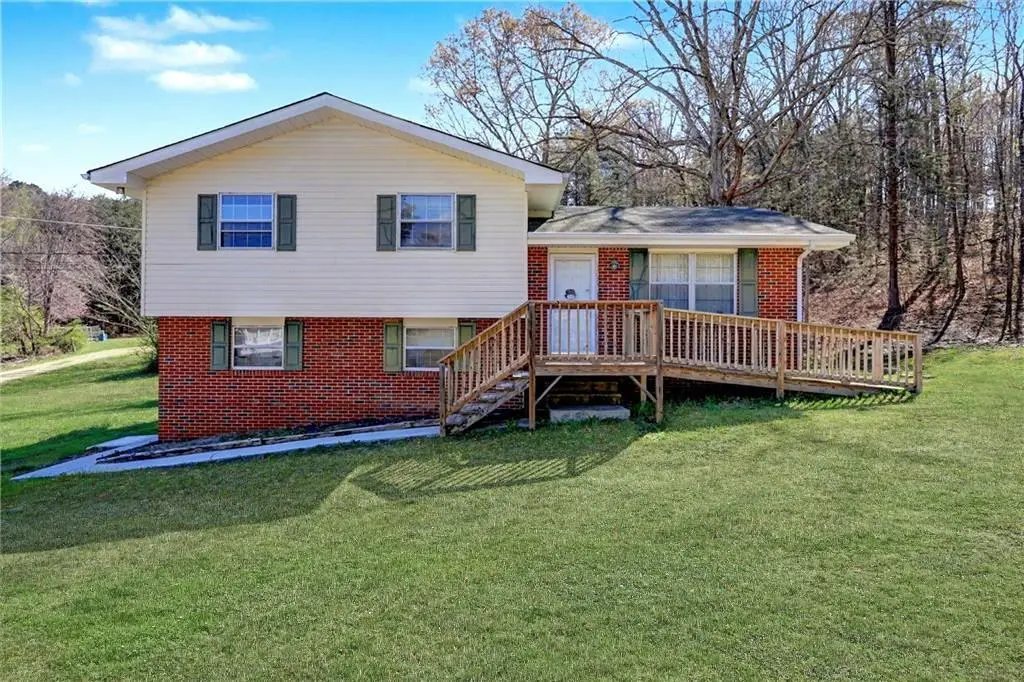
1408 Prospect Rd
Chickamauga, GA 30707
$185,000D
3 bd · 1.5 ba ·
1,082 sqft ·
Built 1974
· SingleFamily
· Pending
· 49 DOM
Cashflow @ list (25.0% down · 7.5%)
Estimated rent
$1,460/mo
Mortgage (P&I)
−$970
Tax + insurance
−$364
HOA
−$0
Vac / Maint / Mgmt
−$307
Net cashflow
$-180/mo
Annual
$-2,163/yr
Cap rate
5.48%
Cash-on-cash
-2.89%
DSCR
0.87
1% rule
0.79%
Cash to close
$51,800
Investor read
- This is a 3-bed/1.5-bath single-family listed at $185k.
- At list price, monthly cash flow is $-180 ($-2k/yr) — negative.
- To cash-flow at today's rent, offer at most $159k (14.1% below list).
- To meet the 1% rule (rent ≥ 1% of price), the offer needs to be $146k (21.1% below list).
- It's been on market 49 days — a 3% lower offer ($179k) is reasonable based on typical stale-listing flexibility.
- Recommended offer: $146k (21.1% below list) — sets the bar for 1% rule.
- Local home prices are declining (-3.0%/yr); year-one equity from $1k of loan paydown is wiped out by about $6k of value loss. Plan a longer hold.
- Location reads 68/100 on livability (#133 in GA) — a middle-class / working-renter tenant base. Strengths: crime A+, cost of living A+, housing A+; Watch: amenities F, commute F, health & safety F.
- Walker County (rural): math 25% / reading 29% proficiency, ranked #114 of 174 in GA (top 66%) — low school quality limits family demand, transient renter base, plan for 1-2y turnover; 61% free/reduced lunch — lower-income household profile, screen leases tightly.
- Watch-outs: flood insurance adds $56/mo.
- Market conditions: 160 active listings in the ZIP; 347 units permitted in Walker County in 2024 (24 in 5+ unit buildings).
- Walker County population projected at -16% by 2050 — secular population decline; favor cash flow + early exit over multi-decade hold.
- 4 sale attempts with the ask held roughly flat each time — persistent listings suggest the price (not the market) is what's stuck; bring a comps-based counter.
- Climate carrying-cost: major flood risk; major wildfire risk; extreme-heat days projected 7→18/yr by 2055 (HVAC capex compounding) — expect insurance premiums to compound above CPI over the hold.
- Cap rate 5.5% vs local median 2.4% in Chickamauga — top-decile yield for the area; either an underpriced asset or a hidden risk that comps aren't pricing in. Stress-test before assuming the spread holds.
Questions for listing agent
- What do current leases actually rent for vs. the listed asking? Can we see a recent rent roll and the last 12 months of T-12 income?
- It's been on market 49 days. Have you received any prior offers? Is the seller open to a 21% concession, seller financing, or rate buy-down credit?
- Built in 1974 — when were the roof, HVAC, electrical panel, plumbing, and water heater last replaced?
- What's the actual annual flood-insurance premium (NFIP or private), and is the property in a SFHA with mandatory coverage?
- Is there a deadline driving the sale (1031 exchange, divorce, estate, relocation)? That informs how much negotiation room exists.
- The area grade is low — what's the realistic commute time and amenity access for the typical tenant pool here? Any planned neighborhood developments (good or bad) we should know about?
- What's the average days-on-market for RENTAL listings here right now (not sales)? A rising rental-DOM trend means longer vacancies and softer asking-rent achievability than the comps imply.
- What's the recent tenant-quality profile in this submarket — average credit score on applications, eviction rate, late-payment / NSF rate, and stable-employment percentage? A property-management company in the area should have these aggregated.
CashFlowRE · CFR-R0KBY14N30BPXG
· Data 1 week ago
cashflowre.app · 2026-05-29