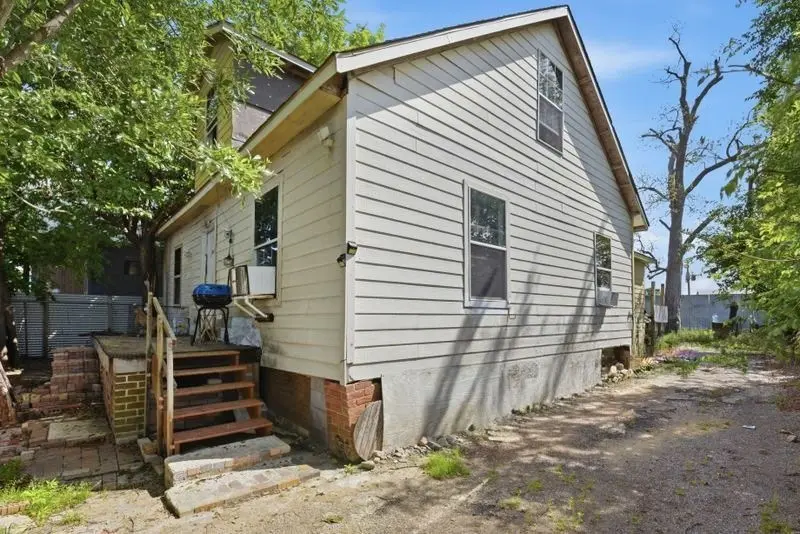
3814 Walker St
Houston, TX 77023
$219,900D+
3 bd · 2.0 ba ·
1,586 sqft ·
Built 1938
· SingleFamily
· Active
· 67 DOM
Cashflow @ list (25.0% down · 7.5%)
Estimated rent
$2,180/mo
Mortgage (P&I)
−$1,153
Tax + insurance
−$618
HOA
−$0
Vac / Maint / Mgmt
−$458
Net cashflow
$-49/mo
Annual
$-591/yr
Cap rate
6.02%
Cash-on-cash
-0.96%
DSCR
0.96
1% rule
0.99%
Cash to close
$61,572
Investor read
- This is a 3-bed/2.0-bath single-family listed at $220k.
- At list price, monthly cash flow is $-49 ($-591/yr) — negative.
- To cash-flow at today's rent, offer at most $211k (4.0% below list).
- To meet the 1% rule (rent ≥ 1% of price), the offer needs to be $218k (0.9% below list).
- It's been on market 67 days — a 6% lower offer ($207k) is reasonable based on typical stale-listing flexibility.
- Recommended offer: $207k (6.0% below list) — sets the bar for market timing.
- Local home prices are declining (-3.0%/yr); year-one equity from $2k of loan paydown is wiped out by about $7k of value loss. Plan a longer hold.
- Location reads 74/100 on livability (#184 in TX, #4,771 nationally) — a middle-class / working-renter tenant base. Strengths: amenities A+, cost of living A+, housing A+; Watch: schools D, crime F.
- Houston ISD (urban): math 27% / reading 35% proficiency, ranked #593 of 826 in TX (top 72%) — families likely to look elsewhere, expect single-tenant / working-renter base with shorter leases; 71% free/reduced lunch — lower-income household profile, screen leases tightly.
- Watch-outs: property tax is 2.9% of price; built in 1938 — expect roof / HVAC / electrical / plumbing capex.
- Market conditions: Rents rising (+2.4%/yr); 166 active listings in the ZIP; 40 comparable units currently listed for rent nearby; rentals leasing fast (median 8d on market — plan ~1-2 weeks tenant-placement turnaround); 29,883 units permitted in Harris County in 2024 (8,621 in 5+ unit buildings).
- Harris County population projected at +47% by 2050 — long-run rental-demand tailwind backs the buy-and-hold thesis.
- Climate carrying-cost: severe wind risk, 99% chance of damaging wind over 30y; extreme-heat days projected 7→24/yr by 2055 (HVAC capex compounding) — expect insurance premiums to compound above CPI over the hold.
- Cap rate 6.0% vs local median 3.2% in Houston — top-decile yield for the area; either an underpriced asset or a hidden risk that comps aren't pricing in. Stress-test before assuming the spread holds.
- At $2,180/mo this rent would consume 51% of the median local household income ($51k/yr) (locally 1311% of renters already pay >50% of income on rent) — very limited rent-growth headroom before tenants either downsize or default.
Questions for listing agent
- What do current leases actually rent for vs. the listed asking? Can we see a recent rent roll and the last 12 months of T-12 income?
- It's been on market 67 days. Have you received any prior offers? Is the seller open to a 6% concession, seller financing, or rate buy-down credit?
- Built in 1938 — when were the roof, HVAC, electrical panel, plumbing, and water heater last replaced?
- Property tax is high relative to price — has the assessment been appealed recently, and will the sale trigger a re-assessment?
- Why hasn't it sold? Are there any deal-killer items the seller is aware of (foundation, flood, title, zoning, code violations)?
- Is there a deadline driving the sale (1031 exchange, divorce, estate, relocation)? That informs how much negotiation room exists.
- Schools are D-rated, which usually means shorter tenancies and higher turnover. Who's the typical renter profile here, and what's been the actual vacancy rate?
- Crime grade is F in this area — have there been break-ins, vandalism, or insurance claims at this property in the last 3 years? What carrier currently insures it and at what premium?
CashFlowRE · CFR-R15EX6C3VR1BJN
· Data 2 days ago
cashflowre.app · 2026-05-29