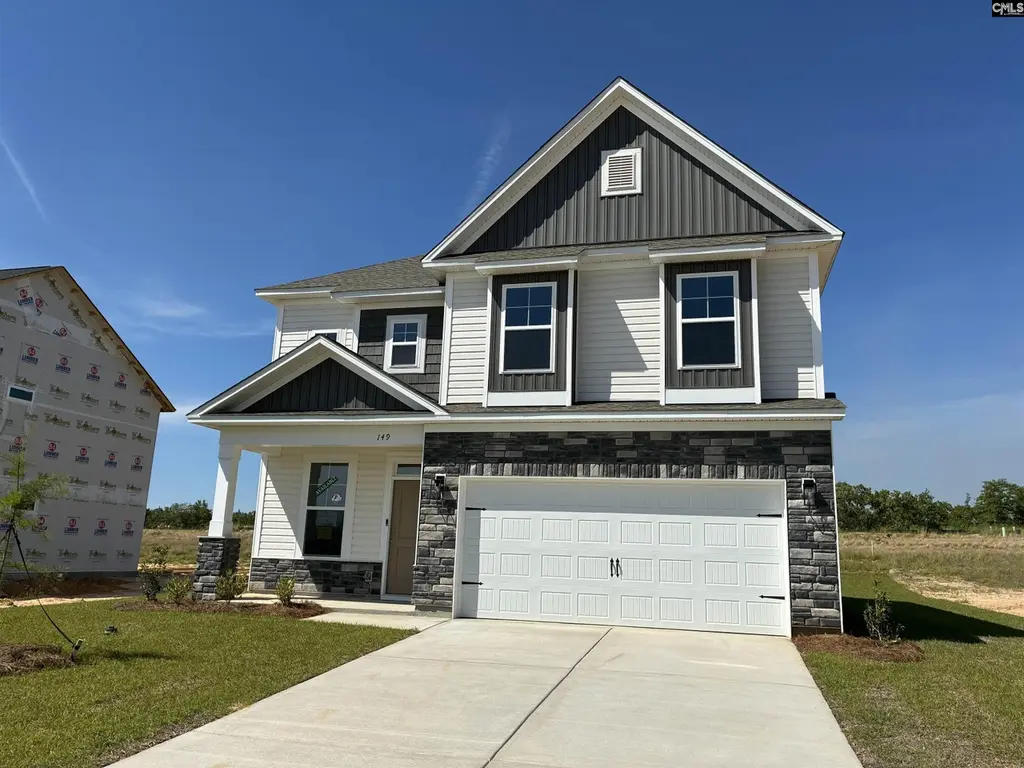
149 Dew Blossom Dr
Lexington, SC 29073
$273,900D
4 bd · 2.5 ba ·
2,018 sqft ·
Built 2026
· SingleFamily
· Pending
· 20 DOM
Cashflow @ list (25.0% down · 7.5%)
Estimated rent
$2,250/mo
Mortgage (P&I)
−$1,436
Tax + insurance
−$456
HOA
−$31
Vac / Maint / Mgmt
−$472
Net cashflow
$-147/mo
Annual
$-1,761/yr
Cap rate
5.65%
Cash-on-cash
-2.30%
DSCR
0.90
1% rule
0.82%
Cash to close
$76,692
Investor read
- This is a 4-bed/2.5-bath single-family listed at $274k. Condition is rated excellent.
- At list price, monthly cash flow is $-147 ($-2k/yr) — negative.
- To cash-flow at today's rent, offer at most $253k (7.8% below list).
- To meet the 1% rule (rent ≥ 1% of price), the offer needs to be $225k (17.9% below list).
- It's been on market 20 days — a 2% lower offer ($270k) is reasonable based on typical stale-listing flexibility.
- Recommended offer: $225k (17.9% below list) — sets the bar for 1% rule.
- Local home prices are declining (-3.0%/yr); year-one equity from $2k of loan paydown is wiped out by about $8k of value loss. Plan a longer hold.
- Location reads 81/100 on livability (#8 in SC, #1,502 nationally) — a professional / high-income tenant draw. Strengths: housing A+, health & safety A+, employment A; Watch: commute F.
- Lexington 01 (suburban): math 42% / reading 53% proficiency, ranked #11 of 80 in SC (top 14%) — families likely to look elsewhere, expect single-tenant / working-renter base with shorter leases.
- Zoned schools: Forts Pond Elementary (math 25% / reading 25%, grade F, #447 of 597 statewide, top 76%, 468 students, 100% FRL); Pelion High (math 14% / reading 77%, grade D-, #164 of 196 statewide, top 84%, 727 students, 65% FRL) — zoned schools average 83% FRL vs 30% district-wide (52 pts higher); higher-poverty schools than district average — tighter screening recommended.
- Zoned-school proficiency averages 35% at this address vs 48% district-wide (-12 pts) — the specific schools serving this property underperform the Lexington 01 average; the district grade overstates school quality for this exact location.
- Market conditions: Rents rising (+3.2%/yr); 564 active listings in the ZIP; 4 comparable units currently listed for rent nearby; rentals at typical pace (median 24d on market — plan ~3-4 weeks tenant-placement turnaround); solid renter incomes; 1,712 units permitted in Lexington County in 2024 (0 in 5+ unit buildings).
- Lexington County population projected at +26% by 2050 — long-run rental-demand tailwind backs the buy-and-hold thesis.
- 5 sale attempts with the ask held roughly flat each time — persistent listings suggest the price (not the market) is what's stuck; bring a comps-based counter.
- Climate carrying-cost: major wind risk, 59% chance of damaging wind over 30y; extreme-heat days projected 7→16/yr by 2055 (HVAC capex compounding) — expect insurance premiums to compound above CPI over the hold.
- This rent runs 35% of the median local income ($77k/yr) — at the standard rent-burdened threshold; future hikes will face affordability resistance.
Questions for listing agent
- What do current leases actually rent for vs. the listed asking? Can we see a recent rent roll and the last 12 months of T-12 income?
- What does the HOA fee cover, when was the last increase, and are there any pending special assessments or reserve-fund shortfalls?
- Is there a deadline driving the sale (1031 exchange, divorce, estate, relocation)? That informs how much negotiation room exists.
- Schools are B-rated — typically a magnet for longer-tenancy family renters. What's the average tenant stay here, and is there a school-zone premium baked into asking?
- The area grade is low — what's the realistic commute time and amenity access for the typical tenant pool here? Any planned neighborhood developments (good or bad) we should know about?
- What's the average days-on-market for RENTAL listings here right now (not sales)? A rising rental-DOM trend means longer vacancies and softer asking-rent achievability than the comps imply.
- What's the recent tenant-quality profile in this submarket — average credit score on applications, eviction rate, late-payment / NSF rate, and stable-employment percentage? A property-management company in the area should have these aggregated.
- How much new for-sale + rental construction is in the pipeline within 1–3 miles? Heavy new supply typically softens prices + rents 12–24 months out; constrained supply supports both.
CashFlowRE · CFR-R2517P17JQ6DRZ
· Data 3 weeks ago
cashflowre.app · 2026-05-29