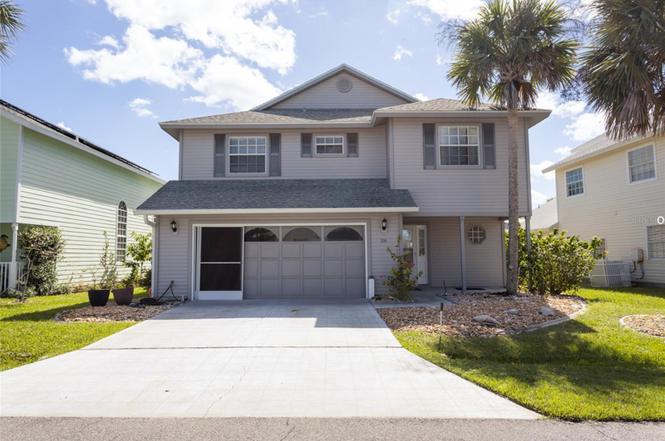
24 Medford Dr
Palm Coast, FL 32137
$499,000C-
4 bd · 3.0 ba ·
1,722 sqft ·
Built 1988
· SingleFamily
· Active
· 246 DOM
Cashflow @ list (25.0% down · 7.5%)
Estimated rent
$5,198/mo
Mortgage (P&I)
−$2,617
Tax + insurance
−$723
HOA
−$250
Vac / Maint / Mgmt
−$1,091
Net cashflow
$516/mo
Annual
$6,189/yr
Cap rate
7.69%
Cash-on-cash
5.00%
DSCR
1.22
1% rule
1.04%
Cash to close
$139,720
Investor read
- This is a 4-bed/3.0-bath single-family listed at $499k.
- At list price, monthly cash flow is $516 ($6k/yr) — positive.
- The deal already cash-flows at list — no discount required.
- Meets the 1% rule at list price ($5k rent vs $499k).
- It's been on market 246 days — a 12% lower offer ($439k) is reasonable based on typical stale-listing flexibility.
- Recommended offer: $439k (12.0% below list) — sets the bar for market timing.
- Local home prices are declining (-3.0%/yr); year-one equity from $3k of loan paydown is wiped out by about $15k of value loss. Plan a longer hold.
- Location reads 69/100 on livability (#478 in FL) — a middle-class / working-renter tenant base. Strengths: housing A+, health & safety A+, cost of living B+; Watch: amenities F, commute F.
- Flagler (rural): math 53% / reading 56% proficiency, ranked #20 of 73 in FL (top 27%) — acceptable for families but not a draw, mixed tenant base, ~2y average lease.
- Zoned schools: Old Kings Elementary School (math 74% / reading 72%, grade A, #271 of 2,144 statewide, top 13%, 979 students, 52% FRL); Matanzas High School (math 36% / reading 53%, grade F, #237 of 667 statewide, top 36%, 1,978 students, 48% FRL) — zoned schools at 50% FRL track the district average.
- Watch-outs: flood insurance adds $66/mo.
- Market conditions: Rents flat; 1600 active listings in the ZIP; 7 comparable units currently listed for rent nearby; rentals at typical pace (median 24d on market — plan ~3-4 weeks tenant-placement turnaround); solid renter incomes; 2,588 units permitted in Flagler County in 2024 (0 in 5+ unit buildings).
- Flagler County population projected at +28% by 2050 — long-run rental-demand tailwind backs the buy-and-hold thesis.
- 2 sale attempts since 15y ago with the ask held roughly flat each time — persistent listings suggest the price (not the market) is what's stuck; bring a comps-based counter.
- Current owner paid $204k; list at $499k implies a 144% gain — meaningful room to come down on a strong offer.
- Climate carrying-cost: severe flood risk; severe wind risk, 99% chance of damaging wind over 30y; extreme-heat days projected 7→21/yr by 2055 (HVAC capex compounding) — expect insurance premiums to compound above CPI over the hold.
- Cap rate 7.7% vs local median 3.8% in Palm Coast — top-decile yield for the area; either an underpriced asset or a hidden risk that comps aren't pricing in. Stress-test before assuming the spread holds.
- At $5,198/mo this rent would consume 74% of the median local household income ($84k/yr) (locally 816% of renters already pay >50% of income on rent) — very limited rent-growth headroom before tenants either downsize or default.
Questions for listing agent
- It's been on market 246 days. Have you received any prior offers? Is the seller open to a 12% concession, seller financing, or rate buy-down credit?
- What's the actual annual flood-insurance premium (NFIP or private), and is the property in a SFHA with mandatory coverage?
- What does the HOA fee cover, when was the last increase, and are there any pending special assessments or reserve-fund shortfalls?
- Why hasn't it sold? Are there any deal-killer items the seller is aware of (foundation, flood, title, zoning, code violations)?
- Is there a deadline driving the sale (1031 exchange, divorce, estate, relocation)? That informs how much negotiation room exists.
- What's the average days-on-market for RENTAL listings here right now (not sales)? A rising rental-DOM trend means longer vacancies and softer asking-rent achievability than the comps imply.
- What's the recent tenant-quality profile in this submarket — average credit score on applications, eviction rate, late-payment / NSF rate, and stable-employment percentage? A property-management company in the area should have these aggregated.
- How much new for-sale + rental construction is in the pipeline within 1–3 miles? Heavy new supply typically softens prices + rents 12–24 months out; constrained supply supports both.
CashFlowRE · CFR-R346963EH9N93T
· Data 2 days ago
cashflowre.app · 2026-05-29