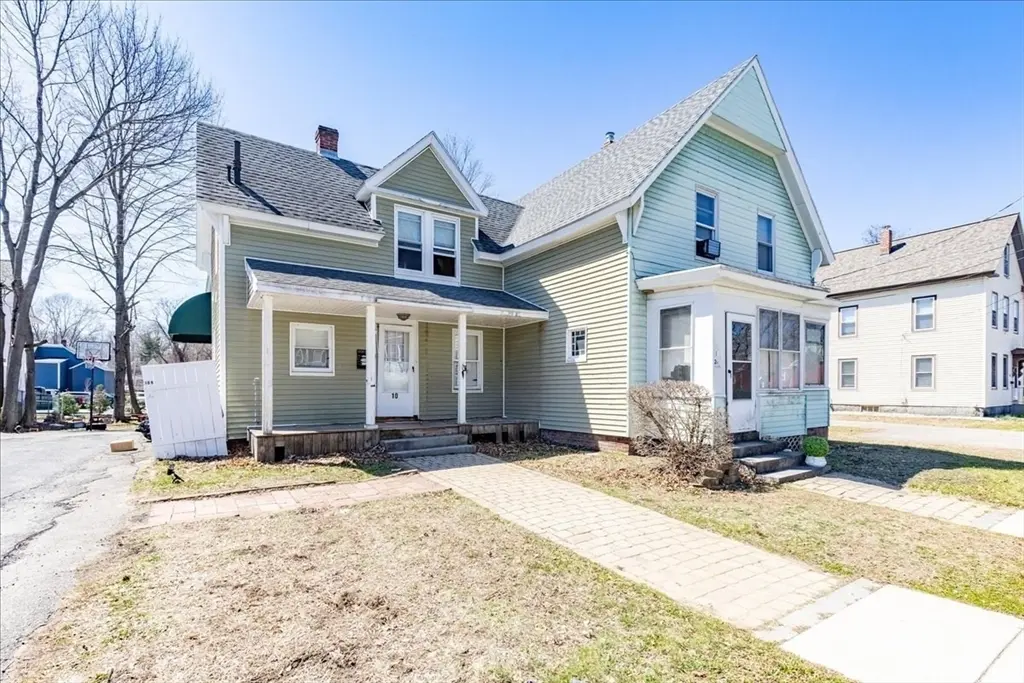
10 Green St
Leominster, MA 01453
$539,000D+
3 bd · 2.0 ba ·
1,854 sqft ·
Built 1900
· MultiFamily
· Active
· 68 DOM
Cashflow @ list (25.0% down · 7.5%)
Estimated rent
$4,871/mo
Mortgage (P&I)
−$2,827
Tax + insurance
−$638
HOA
−$0
Vac / Maint / Mgmt
−$1,023
Net cashflow
$383/mo
Annual
$4,600/yr
Cap rate
7.15%
Cash-on-cash
3.05%
DSCR
1.14
1% rule
0.90%
Cash to close
$150,920
Investor read
- This is a 3-bed/2.0-bath multifamily listed at $539k.
- At list price, monthly cash flow is $383 ($5k/yr) — positive.
- The deal already cash-flows at list — no discount required.
- To meet the 1% rule (rent ≥ 1% of price), the offer needs to be $487k (9.6% below list).
- It's been on market 68 days — a 6% lower offer ($507k) is reasonable based on typical stale-listing flexibility.
- Recommended offer: $487k (9.6% below list) — sets the bar for 1% rule.
- Local home prices are declining (-3.0%/yr); year-one equity from $4k of loan paydown is wiped out by about $16k of value loss. Plan a longer hold.
- Location reads 69/100 on livability (#139 in MA) — a middle-class / working-renter tenant base. Strengths: housing A+, health & safety B+; Watch: schools C-, commute D+, cost of living D+.
- Leominster (suburban): math 25% / reading 38% proficiency, ranked #247 of 302 in MA (top 82%) — families likely to look elsewhere, expect single-tenant / working-renter base with shorter leases.
- Watch-outs: built in 1900 — expect roof / HVAC / electrical / plumbing capex.
- Market conditions: Rents rising fast (+4.8%/yr); 68 active listings in the ZIP; 3 comparable units currently listed for rent nearby; rentals at typical pace (median 26d on market — plan ~3-4 weeks tenant-placement turnaround); solid renter incomes; 2,293 units permitted in Worcester County in 2024 (1,205 in 5+ unit buildings).
- 5 sale attempts since 31y ago with the ask held roughly flat each time — persistent listings suggest the price (not the market) is what's stuck; bring a comps-based counter.
- Current owner paid $350k; list at $539k implies a 54% gain — meaningful room to come down on a strong offer.
- Climate carrying-cost: major wind risk, 27% chance of damaging wind over 30y — expect insurance premiums to compound above CPI over the hold.
- Cap rate 7.1% vs local median 3.2% in Leominster — top-decile yield for the area; either an underpriced asset or a hidden risk that comps aren't pricing in. Stress-test before assuming the spread holds.
- At $4,871/mo this rent would consume 69% of the median local household income ($84k/yr) (locally 1633% of renters already pay >50% of income on rent) — very limited rent-growth headroom before tenants either downsize or default.
Questions for listing agent
- It's been on market 68 days. Have you received any prior offers? Is the seller open to a 10% concession, seller financing, or rate buy-down credit?
- Built in 1900 — when were the roof, HVAC, electrical panel, plumbing, and water heater last replaced?
- Why hasn't it sold? Are there any deal-killer items the seller is aware of (foundation, flood, title, zoning, code violations)?
- Is there a deadline driving the sale (1031 exchange, divorce, estate, relocation)? That informs how much negotiation room exists.
- Crime grade is D in this area — have there been break-ins, vandalism, or insurance claims at this property in the last 3 years? What carrier currently insures it and at what premium?
- The area grade is low — what's the realistic commute time and amenity access for the typical tenant pool here? Any planned neighborhood developments (good or bad) we should know about?
- What's the average days-on-market for RENTAL listings here right now (not sales)? A rising rental-DOM trend means longer vacancies and softer asking-rent achievability than the comps imply.
- What's the recent tenant-quality profile in this submarket — average credit score on applications, eviction rate, late-payment / NSF rate, and stable-employment percentage? A property-management company in the area should have these aggregated.
CashFlowRE · CFR-R38ESZ07R4MTVN
· Data 10 h ago
cashflowre.app · 2026-05-29