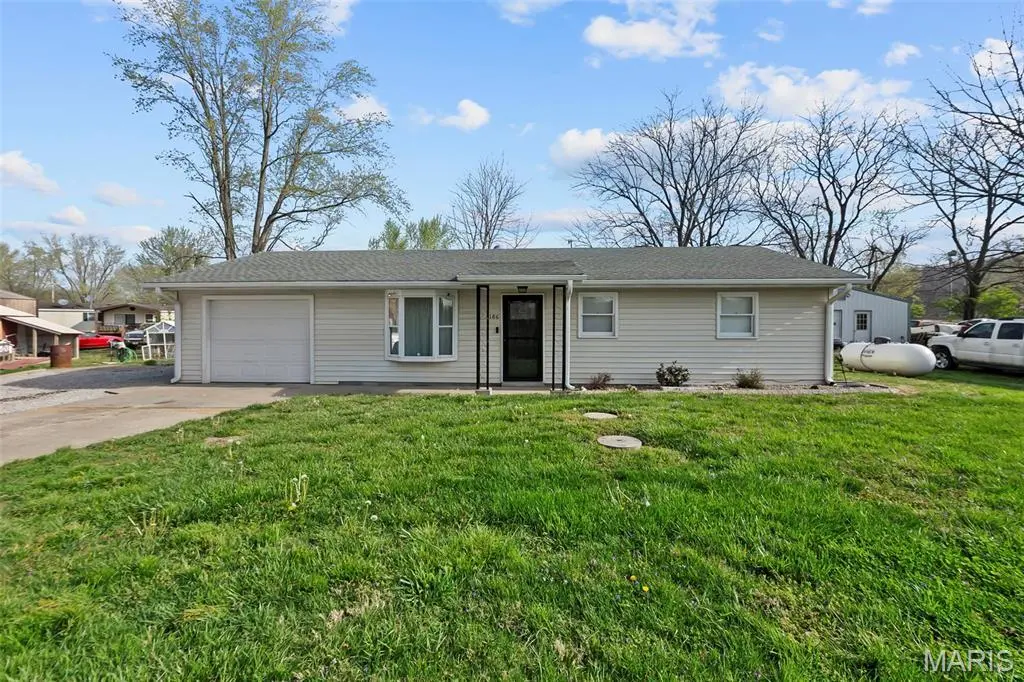
186 Oriole St
Cape Girardeau, MO 63701
$185,000F
2 bd · 1.0 ba ·
1,162 sqft ·
Built 1990
· SingleFamily
· Pending
· 31 DOM
Cashflow @ list (25.0% down · 7.5%)
Estimated rent
$1,203/mo
Mortgage (P&I)
−$970
Tax + insurance
−$127
HOA
−$0
Vac / Maint / Mgmt
−$253
Net cashflow
$-146/mo
Annual
$-1,755/yr
Cap rate
5.34%
Cash-on-cash
-3.39%
DSCR
0.85
1% rule
0.65%
Cash to close
$51,800
Investor read
- This is a 2-bed/1.0-bath single-family listed at $185k.
- At list price, monthly cash flow is $-146 ($-2k/yr) — negative.
- To cash-flow at today's rent, offer at most $159k (14.0% below list).
- To meet the 1% rule (rent ≥ 1% of price), the offer needs to be $120k (34.9% below list).
- It's been on market 31 days — a 3% lower offer ($179k) is reasonable based on typical stale-listing flexibility.
- Recommended offer: $120k (34.9% below list) — sets the bar for 1% rule.
- Local home prices are declining (-3.0%/yr); year-one equity from $1k of loan paydown is wiped out by about $6k of value loss. Plan a longer hold.
- Location reads 64/100 on livability (#297 in MO) — a middle-class / working-renter tenant base. Strengths: cost of living A+, housing A+; Watch: employment D+, crime F, amenities F.
- Nell Holcomb R-IV (rural): math 30% / reading 45% proficiency, ranked #336 of 535 in MO (top 63%) — families likely to look elsewhere, expect single-tenant / working-renter base with shorter leases.
- Zoned schools: Nell Holcomb Elem. (math 32% / reading 47%, grade F, #537 of 1,115 statewide, top 53%, 244 students, 41% FRL) — zoned schools at 41% FRL track the district average.
- Market conditions: Rents rising (+3.3%/yr); 326 active listings in the ZIP; 81 units permitted in Cape Girardeau County in 2024 (0 in 5+ unit buildings).
- Cape Girardeau County population projected at +17% by 2050 — long-run rental-demand tailwind backs the buy-and-hold thesis.
- 3 sale attempts since 11y ago with the ask held roughly flat each time — persistent listings suggest the price (not the market) is what's stuck; bring a comps-based counter.
- Climate carrying-cost: major flood risk; extreme-heat days projected 7→21/yr by 2055 (HVAC capex compounding) — expect insurance premiums to compound above CPI over the hold.
- Cap rate 5.3% vs local median 3.9% in Cape Girardeau — top-decile yield for the area; either an underpriced asset or a hidden risk that comps aren't pricing in. Stress-test before assuming the spread holds.
Questions for listing agent
- What do current leases actually rent for vs. the listed asking? Can we see a recent rent roll and the last 12 months of T-12 income?
- It's been on market 31 days. Have you received any prior offers? Is the seller open to a 35% concession, seller financing, or rate buy-down credit?
- Is there a deadline driving the sale (1031 exchange, divorce, estate, relocation)? That informs how much negotiation room exists.
- Crime grade is F in this area — have there been break-ins, vandalism, or insurance claims at this property in the last 3 years? What carrier currently insures it and at what premium?
- The area grade is low — what's the realistic commute time and amenity access for the typical tenant pool here? Any planned neighborhood developments (good or bad) we should know about?
- What's the average days-on-market for RENTAL listings here right now (not sales)? A rising rental-DOM trend means longer vacancies and softer asking-rent achievability than the comps imply.
- What's the recent tenant-quality profile in this submarket — average credit score on applications, eviction rate, late-payment / NSF rate, and stable-employment percentage? A property-management company in the area should have these aggregated.
- How much new for-sale + rental construction is in the pipeline within 1–3 miles? Heavy new supply typically softens prices + rents 12–24 months out; constrained supply supports both.
CashFlowRE · CFR-R38WAEFYHNPQMN
· Data 1 week ago
cashflowre.app · 2026-05-29