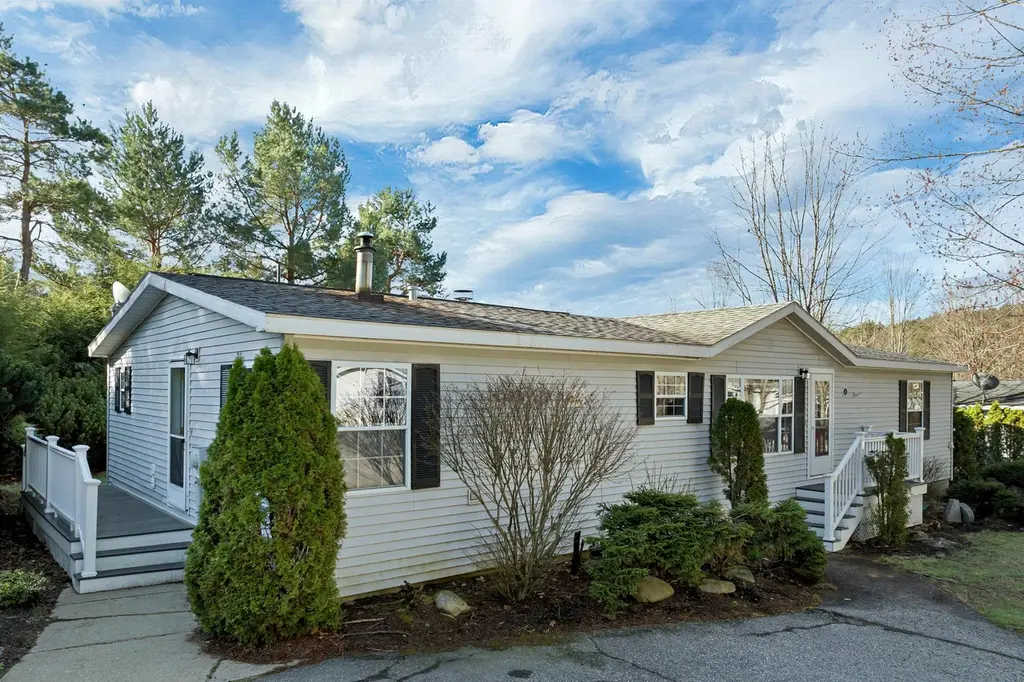
11 Lilac Ln #11
Belmont, NH 03220
$89,900B-
3 bd · 2.0 ba ·
1,512 sqft ·
Built 1995
· Manufactured
· Pending
· 15 DOM
Cashflow @ list (25.0% down · 7.5%)
Estimated rent
$1,996/mo
Mortgage (P&I)
−$471
Tax + insurance
−$150
HOA
−$0
Vac / Maint / Mgmt
−$419
Net cashflow
$955/mo
Annual
$11,463/yr
Cap rate
19.04%
Cash-on-cash
45.54%
DSCR
3.03
1% rule
2.22%
Cash to close
$25,172
Investor read
- This is a 3-bed/2.0-bath manufactured listed at $90k. Condition is rated fair.
- At list price, monthly cash flow is $955 ($11k/yr) — positive.
- The deal already cash-flows at list — no discount required.
- Meets the 1% rule at list price ($2k rent vs $90k).
- It's been on market 15 days — a 2% lower offer ($89k) is reasonable based on typical stale-listing flexibility.
- Recommended offer: $89k (1.5% below list) — sets the bar for market timing.
- Local home prices are declining (-3.0%/yr); year-one equity from $622 of loan paydown is wiped out by about $3k of value loss. Plan a longer hold.
- Location reads 61/100 on livability (#89 in NH) — a middle-class / working-renter tenant base. Strengths: crime A+, cost of living A+; Watch: health & safety C-, housing D, amenities F.
- Shaker Regional School District (rural): math 27% / reading 45% proficiency, ranked #70 of 98 in NH (top 71%) — families likely to look elsewhere, expect single-tenant / working-renter base with shorter leases.
- Zoned schools: Belmont Elementary School (math 27% / reading 32%, grade F, #201 of 263 statewide, top 82%, 334 students, 40% FRL).
- Market conditions: 62 active listings in the ZIP; 301 units permitted in Belknap County in 2024 (32 in 5+ unit buildings).
- Belknap County population projected at -10% by 2050 — secular population decline; favor cash flow + early exit over multi-decade hold.
- 2 sale attempts with the ask held roughly flat each time — persistent listings suggest the price (not the market) is what's stuck; bring a comps-based counter.
- At projected returns (-3.0% appreciation + 3.0% rent growth), your $25k cash investment doubles in ~3 years — after that, you're playing with house money.
- Cap rate 19.0% vs local median 1.7% in Belmont — top-decile yield for the area; either an underpriced asset or a hidden risk that comps aren't pricing in. Stress-test before assuming the spread holds.
Questions for listing agent
- Have any recent inspections been done? Can we get a copy of the seller's disclosures and any deferred-maintenance estimates?
- Is there a deadline driving the sale (1031 exchange, divorce, estate, relocation)? That informs how much negotiation room exists.
- Schools are D-rated, which usually means shorter tenancies and higher turnover. Who's the typical renter profile here, and what's been the actual vacancy rate?
- What's the average days-on-market for RENTAL listings here right now (not sales)? A rising rental-DOM trend means longer vacancies and softer asking-rent achievability than the comps imply.
- What's the recent tenant-quality profile in this submarket — average credit score on applications, eviction rate, late-payment / NSF rate, and stable-employment percentage? A property-management company in the area should have these aggregated.
- How much new for-sale + rental construction is in the pipeline within 1–3 miles? Heavy new supply typically softens prices + rents 12–24 months out; constrained supply supports both.
Repairs flagged (vision-AI assessment)
- Moderate: Kitchen cabinets — Worn and dated appearance.
- Moderate: Bathtubs and fixtures — Dated appearance and potential leaks.
- Moderate: Landscaping — Overgrown and needs trimming for curb appeal.
CashFlowRE · CFR-R3TNJD0FMK4T1N
· Data 2 days ago
cashflowre.app · 2026-05-29