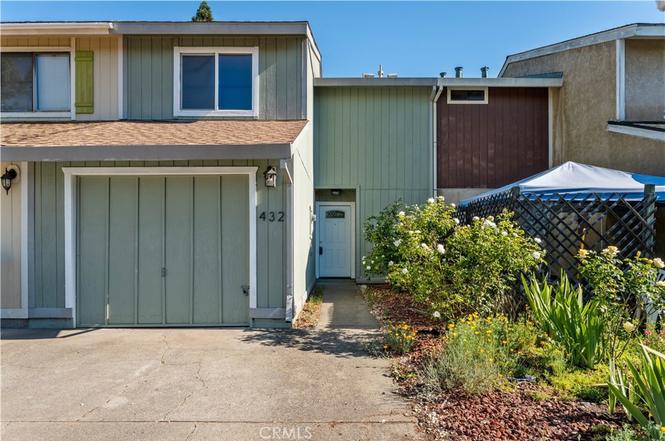
432 Ford
Ukiah, CA 95482
$339,999D-
3 bd · 1.5 ba ·
1,200 sqft ·
Built 1980
· Townhouse
· Coming Soon
· 2 DOM
Cashflow @ list (25.0% down · 7.5%)
Estimated rent
$2,633/mo
Mortgage (P&I)
−$1,783
Tax + insurance
−$267
HOA
−$0
Vac / Maint / Mgmt
−$553
Net cashflow
$30/mo
Annual
$365/yr
Cap rate
6.40%
Cash-on-cash
0.38%
DSCR
1.02
1% rule
0.77%
Cash to close
$95,200
Investor read
- This is a 3-bed/1.5-bath townhouse listed at $340k.
- At list price, monthly cash flow is $30 ($365/yr) — positive.
- The deal already cash-flows at list — no discount required.
- To meet the 1% rule (rent ≥ 1% of price), the offer needs to be $263k (22.6% below list).
- Only 2 days on market — expect competitive offers; lowballing is unlikely to land.
- Recommended offer: $263k (22.6% below list) — sets the bar for 1% rule.
- Local home prices are declining (-3.0%/yr); year-one equity from $2k of loan paydown is wiped out by about $10k of value loss. Plan a longer hold.
- Location reads 64/100 on livability (#425 in CA) — a middle-class / working-renter tenant base. Strengths: amenities A+, health & safety A+; Watch: schools C-, employment D, crime D-.
- Ukiah Unified (town): math 24% / reading 37% proficiency, ranked #1,018 of 1,400 in CA (top 73%) — families likely to look elsewhere, expect single-tenant / working-renter base with shorter leases; 65% free/reduced lunch — lower-income household profile, screen leases tightly.
- Market conditions: Rents rising fast (+6.1%/yr); 153 active listings in the ZIP; 2 comparable units currently listed for rent nearby; 8 units permitted in Mendocino County in 2024 (0 in 5+ unit buildings).
- Mendocino County population projected at -15% by 2050 — secular population decline; favor cash flow + early exit over multi-decade hold.
- Current owner paid $54k; list at $340k implies a 536% gain — meaningful room to come down on a strong offer.
- Climate carrying-cost: severe wildfire risk; extreme-heat days projected 7→15/yr by 2055 (HVAC capex compounding) — expect insurance premiums to compound above CPI over the hold.
- Cap rate 6.4% vs local median 3.0% in Ukiah — top-decile yield for the area; either an underpriced asset or a hidden risk that comps aren't pricing in. Stress-test before assuming the spread holds.
- At $2,633/mo this rent would consume 45% of the median local household income ($70k/yr) (locally 1349% of renters already pay >50% of income on rent) — very limited rent-growth headroom before tenants either downsize or default.
Questions for listing agent
- Is there a deadline driving the sale (1031 exchange, divorce, estate, relocation)? That informs how much negotiation room exists.
- Crime grade is D in this area — have there been break-ins, vandalism, or insurance claims at this property in the last 3 years? What carrier currently insures it and at what premium?
- The area grade is low — what's the realistic commute time and amenity access for the typical tenant pool here? Any planned neighborhood developments (good or bad) we should know about?
- What's the average days-on-market for RENTAL listings here right now (not sales)? A rising rental-DOM trend means longer vacancies and softer asking-rent achievability than the comps imply.
- What's the recent tenant-quality profile in this submarket — average credit score on applications, eviction rate, late-payment / NSF rate, and stable-employment percentage? A property-management company in the area should have these aggregated.
- How much new for-sale + rental construction is in the pipeline within 1–3 miles? Heavy new supply typically softens prices + rents 12–24 months out; constrained supply supports both.
CashFlowRE · CFR-R4DXS5FDHRMW7W
· Data 1 day ago
cashflowre.app · 2026-05-29