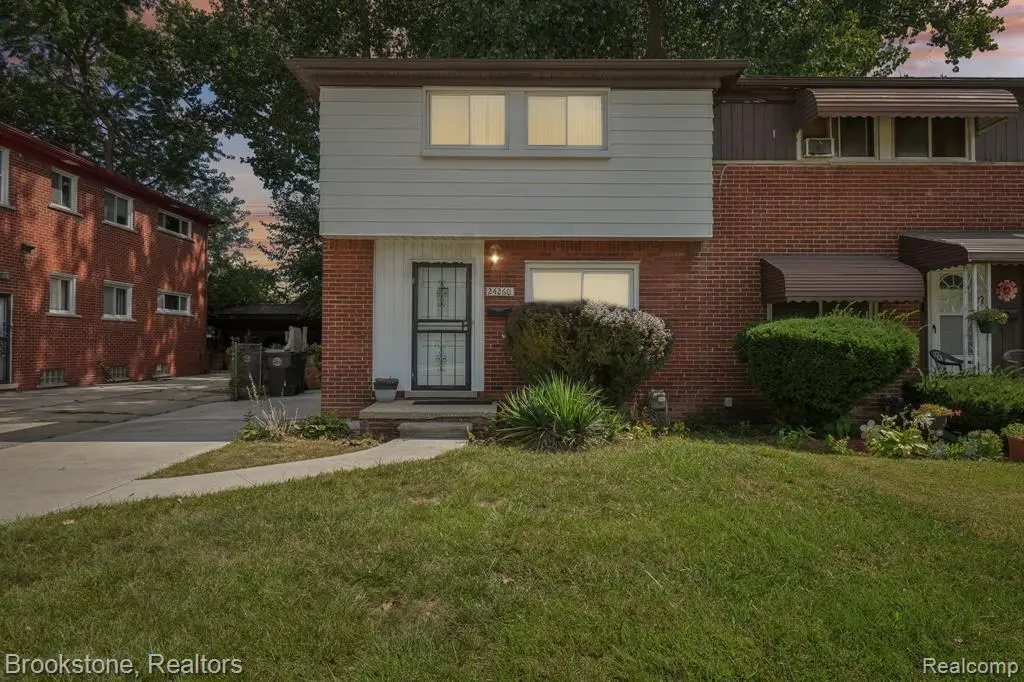
24260 Coolidge Highway Hwy
Oak Park, MI 48237
$149,000C
2 bd · 1.5 ba ·
1,095 sqft ·
Built 1953
· SingleFamily
· Active
· 51 DOM
Cashflow @ list (25.0% down · 7.5%)
Estimated rent
$1,432/mo
Mortgage (P&I)
−$781
Tax + insurance
−$152
HOA
−$0
Vac / Maint / Mgmt
−$301
Net cashflow
$198/mo
Annual
$2,378/yr
Cap rate
7.89%
Cash-on-cash
5.70%
DSCR
1.25
1% rule
0.96%
Cash to close
$41,720
Investor read
- This is a 2-bed/1.5-bath single-family listed at $149k.
- At list price, monthly cash flow is $198 ($2k/yr) — positive.
- The deal already cash-flows at list — no discount required.
- To meet the 1% rule (rent ≥ 1% of price), the offer needs to be $143k (3.9% below list).
- It's been on market 51 days — a 3% lower offer ($145k) is reasonable based on typical stale-listing flexibility.
- Recommended offer: $143k (3.9% below list) — sets the bar for 1% rule.
- Local home prices are declining (-3.0%/yr); year-one equity from $1k of loan paydown is wiped out by about $4k of value loss. Plan a longer hold.
- Location reads 83/100 on livability (#41 in MI, #888 nationally) — a professional / high-income tenant draw. Strengths: amenities A+, commute A+, cost of living A+; Watch: schools C-, employment D+, crime D.
- Oak Park School District (suburban): math 5% / reading 15% proficiency, ranked #521 of 540 in MI (top 96%) — low school quality limits family demand, transient renter base, plan for 1-2y turnover; 77% free/reduced lunch — lower-income household profile, screen leases tightly.
- Watch-outs: built in 1953 — expect roof / HVAC / electrical / plumbing capex.
- Market conditions: Rents rising (+2.7%/yr); 80 active listings in the ZIP; 30 comparable units currently listed for rent nearby; rentals at typical pace (median 24d on market — plan ~3-4 weeks tenant-placement turnaround); 2,614 units permitted in Oakland County in 2024 (721 in 5+ unit buildings).
- Oakland County population projected at +10% by 2050 — modest demand growth; plan on rents tracking national, not racing it.
- 8 sale attempts with the ask held roughly flat each time — persistent listings suggest the price (not the market) is what's stuck; bring a comps-based counter.
- Cap rate 7.9% vs local median 4.9% in Oak Park — top-decile yield for the area; either an underpriced asset or a hidden risk that comps aren't pricing in. Stress-test before assuming the spread holds.
Questions for listing agent
- It's been on market 51 days. Have you received any prior offers? Is the seller open to a 4% concession, seller financing, or rate buy-down credit?
- Built in 1953 — when were the roof, HVAC, electrical panel, plumbing, and water heater last replaced?
- Is there a deadline driving the sale (1031 exchange, divorce, estate, relocation)? That informs how much negotiation room exists.
- Crime grade is D in this area — have there been break-ins, vandalism, or insurance claims at this property in the last 3 years? What carrier currently insures it and at what premium?
- What's the average days-on-market for RENTAL listings here right now (not sales)? A rising rental-DOM trend means longer vacancies and softer asking-rent achievability than the comps imply.
- What's the recent tenant-quality profile in this submarket — average credit score on applications, eviction rate, late-payment / NSF rate, and stable-employment percentage? A property-management company in the area should have these aggregated.
- How much new for-sale + rental construction is in the pipeline within 1–3 miles? Heavy new supply typically softens prices + rents 12–24 months out; constrained supply supports both.
CashFlowRE · CFR-R4ZN6MAZ2TY5JY
· Data 2 days ago
cashflowre.app · 2026-05-29