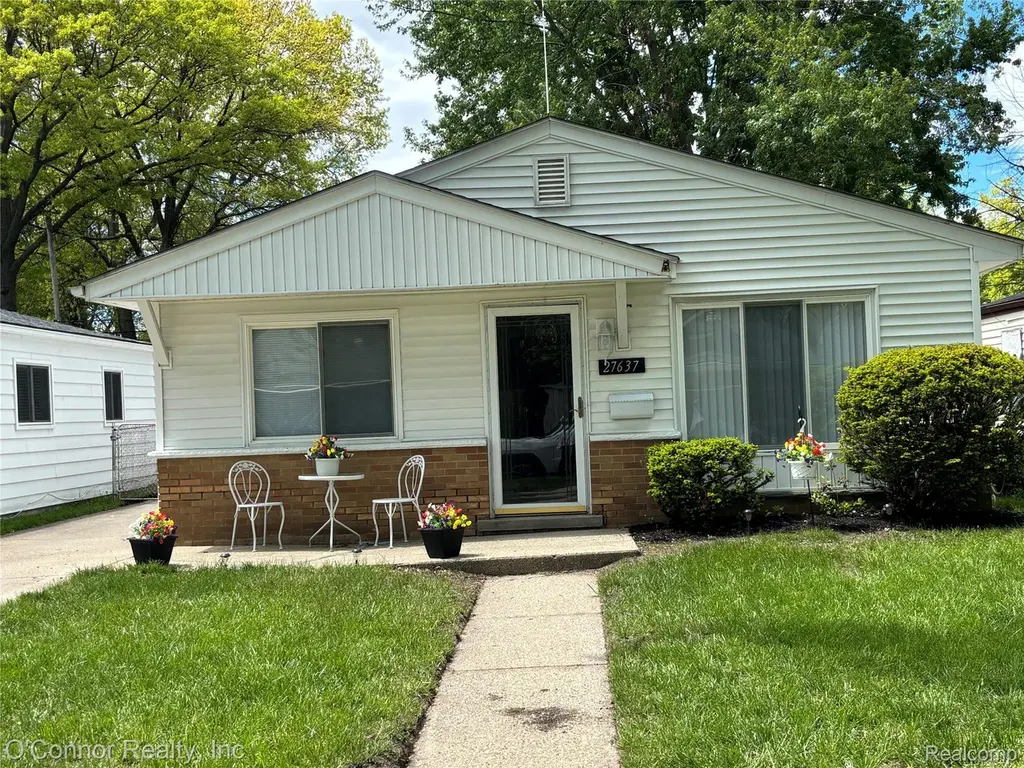
27637 Barrington St
Madison Heights, MI 48071
$189,900D+
3 bd · 1.0 ba ·
1,014 sqft ·
Built 1958
· SingleFamily
· Pending
· 24 DOM
Cashflow @ list (25.0% down · 7.5%)
Estimated rent
$1,886/mo
Mortgage (P&I)
−$996
Tax + insurance
−$250
HOA
−$0
Vac / Maint / Mgmt
−$396
Net cashflow
$244/mo
Annual
$2,930/yr
Cap rate
7.84%
Cash-on-cash
5.51%
DSCR
1.25
1% rule
0.99%
Cash to close
$53,172
Investor read
- This is a 3-bed/1.0-bath single-family listed at $190k.
- At list price, monthly cash flow is $244 ($3k/yr) — positive.
- The deal already cash-flows at list — no discount required.
- To meet the 1% rule (rent ≥ 1% of price), the offer needs to be $189k (0.7% below list).
- It's been on market 24 days — a 2% lower offer ($187k) is reasonable based on typical stale-listing flexibility.
- Recommended offer: $187k (1.5% below list) — sets the bar for market timing.
- Local home prices are declining (-3.0%/yr); year-one equity from $1k of loan paydown is wiped out by about $6k of value loss. Plan a longer hold.
- Location reads 81/100 on livability (#62 in MI, #1,347 nationally) — a professional / high-income tenant draw. Strengths: commute A+, cost of living A+, housing A+; Watch: schools D+, health & safety D.
- Madison District Public Schools (suburban): math 9% / reading 21% proficiency, ranked #502 of 540 in MI (top 93%) — low school quality limits family demand, transient renter base, plan for 1-2y turnover; 70% free/reduced lunch — lower-income household profile, screen leases tightly.
- Watch-outs: built in 1958 — expect roof / HVAC / electrical / plumbing capex.
- Market conditions: Rents rising (+2.8%/yr); 135 active listings in the ZIP; 23 comparable units currently listed for rent nearby; rentals leasing fast (median 12d on market — plan ~1-2 weeks tenant-placement turnaround); 2,614 units permitted in Oakland County in 2024 (721 in 5+ unit buildings).
- Oakland County population projected at +10% by 2050 — modest demand growth; plan on rents tracking national, not racing it.
- 4 sale attempts since 17y ago with the ask held roughly flat each time — persistent listings suggest the price (not the market) is what's stuck; bring a comps-based counter.
- Current owner paid $50k; list at $190k implies a 280% gain — meaningful room to come down on a strong offer.
- Cap rate 7.8% vs local median 5.7% in Madison Heights — top-decile yield for the area; either an underpriced asset or a hidden risk that comps aren't pricing in. Stress-test before assuming the spread holds.
- This rent runs 33% of the median local income ($70k/yr) — at the standard rent-burdened threshold; future hikes will face affordability resistance.
Questions for listing agent
- Built in 1958 — when were the roof, HVAC, electrical panel, plumbing, and water heater last replaced?
- Is there a deadline driving the sale (1031 exchange, divorce, estate, relocation)? That informs how much negotiation room exists.
- Schools are D-rated, which usually means shorter tenancies and higher turnover. Who's the typical renter profile here, and what's been the actual vacancy rate?
- The area grade is low — what's the realistic commute time and amenity access for the typical tenant pool here? Any planned neighborhood developments (good or bad) we should know about?
- What's the average days-on-market for RENTAL listings here right now (not sales)? A rising rental-DOM trend means longer vacancies and softer asking-rent achievability than the comps imply.
- What's the recent tenant-quality profile in this submarket — average credit score on applications, eviction rate, late-payment / NSF rate, and stable-employment percentage? A property-management company in the area should have these aggregated.
- How much new for-sale + rental construction is in the pipeline within 1–3 miles? Heavy new supply typically softens prices + rents 12–24 months out; constrained supply supports both.
CashFlowRE · CFR-R5ADKQE9ZS3HXE
· Data 1 week ago
cashflowre.app · 2026-05-29