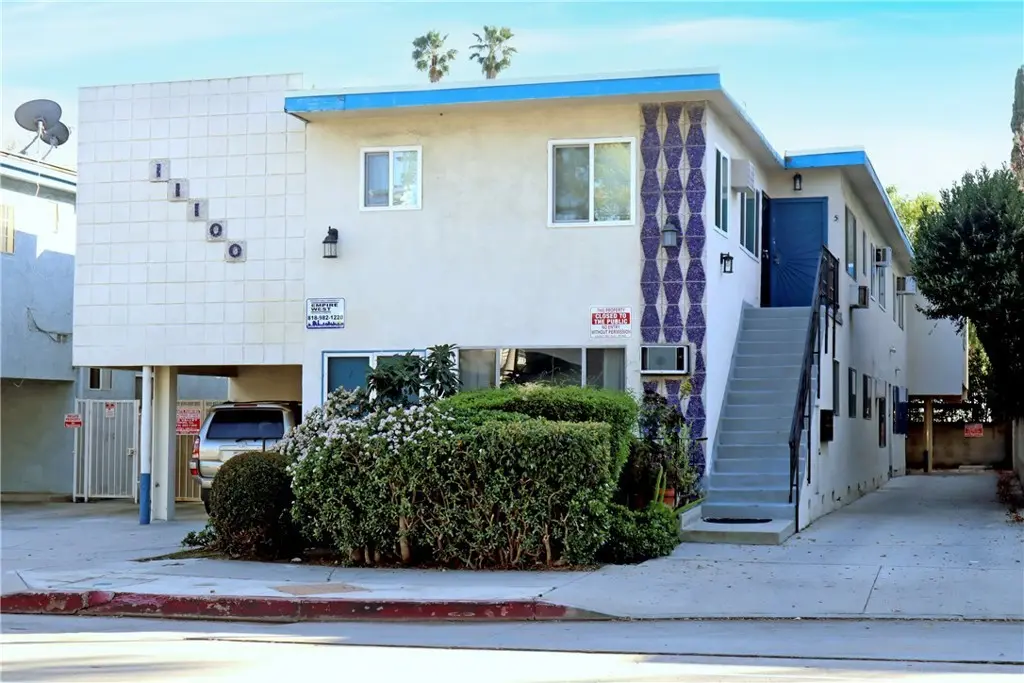
11100 Camarillo St
Los Angeles, CA 91602
$1,995,000C
96 bd · 88.0 ba ·
7,236 sqft ·
Built 1962
· MultiFamily
· Active
· 103 DOM
Cashflow @ list (25.0% down · 7.5%)
Estimated rent
$20,642/mo
Mortgage (P&I)
−$10,462
Tax + insurance
−$3,325
HOA
−$0
Vac / Maint / Mgmt
−$4,335
Net cashflow
$2,520/mo
Annual
$30,242/yr
Cap rate
7.81%
Cash-on-cash
5.41%
DSCR
1.24
1% rule
1.03%
Cash to close
$558,600
Investor read
- This is a 5×1bd/1ba + 2×2bd/2ba + 1×3bd/2ba units multifamily listed at $2.00M. Condition is rated fair.
- At list price, monthly cash flow is $3k ($30k/yr) — positive. Per door: $315/mo.
- The deal already cash-flows at list — no discount required.
- Meets the 1% rule at list price ($21k rent vs $2.00M).
- It's been on market 103 days — a 9% lower offer ($1.82M) is reasonable based on typical stale-listing flexibility.
- Recommended offer: $1.82M (9.0% below list) — sets the bar for market timing.
- Local home prices are declining (-3.0%/yr); year-one equity from $14k of loan paydown is wiped out by about $60k of value loss. Plan a longer hold.
- Location reads 68/100 on livability (#273 in CA) — a middle-class / working-renter tenant base. Strengths: amenities A+, commute A+, employment B; Watch: health & safety C-, schools D+, crime F.
- Los Angeles Unified (urban): math 29% / reading 54% proficiency, ranked #223 of 517 in CA (top 43%) — families likely to look elsewhere, expect single-tenant / working-renter base with shorter leases; 67% free/reduced lunch — lower-income household profile, screen leases tightly.
- Market conditions: Rents soft (-1.2%/yr); 86 active listings in the ZIP; solid renter incomes; 19,697 units permitted in Los Angeles County in 2024 (9,426 in 5+ unit buildings).
- Los Angeles County population projected at +9% by 2050 — modest demand growth; plan on rents tracking national, not racing it.
- 2 sale attempts since 2y ago; this cycle's ask has dropped $105k (5%) from the opening price — seller is motivated, your offer sets the floor, not the list.
- Climate carrying-cost: extreme-heat days projected 7→22/yr by 2055 (HVAC capex compounding) — expect insurance premiums to compound above CPI over the hold.
- Cap rate 7.8% vs local median 2.1% in Los Angeles — top-decile yield for the area; either an underpriced asset or a hidden risk that comps aren't pricing in. Stress-test before assuming the spread holds.
- At $20,642/mo this rent would consume 241% of the median local household income ($103k/yr) (locally 1972% of renters already pay >50% of income on rent) — very limited rent-growth headroom before tenants either downsize or default.
Questions for listing agent
- It's been on market 103 days. Have you received any prior offers? Is the seller open to a 9% concession, seller financing, or rate buy-down credit?
- Can we see the unit-by-unit rent roll, current vacancy, and any below-market leases? What's the average tenancy length?
- What capital expenditures (roof, boiler, parking lot, exteriors) have been made in the last 5 years, and what's planned in the next 2?
- Have any recent inspections been done? Can we get a copy of the seller's disclosures and any deferred-maintenance estimates?
- Built in 1962 — when were the roof, HVAC, electrical panel, plumbing, and water heater last replaced?
- Why hasn't it sold? Are there any deal-killer items the seller is aware of (foundation, flood, title, zoning, code violations)?
- Is there a deadline driving the sale (1031 exchange, divorce, estate, relocation)? That informs how much negotiation room exists.
- Schools are D-rated, which usually means shorter tenancies and higher turnover. Who's the typical renter profile here, and what's been the actual vacancy rate?
Repairs flagged (vision-AI assessment)
- Minor: Exterior siding — There is some discoloration and wear visible on the siding.
- Minor: Interior paint — There is some discoloration and wear visible on the paint.
- Minor: Windows — There is some discoloration and wear visible on the window frames.
- Minor: HVAC components — There is some wear visible on the components.
CashFlowRE · CFR-R5JG50028BM66V
· Data 2 days ago
cashflowre.app · 2026-05-29