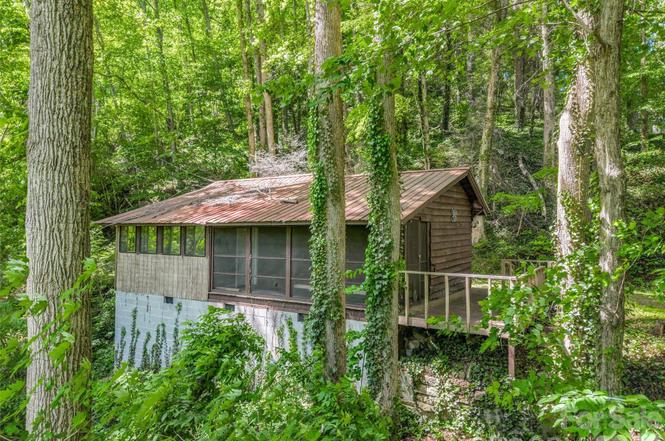
247 Legacy Layne Dr
Gerton, NC 28792
$110,000B-
1 bd · 1.0 ba ·
508 sqft ·
Built 1950
· SingleFamily
· Active
· 1 DOM
Cashflow @ list (25.0% down · 7.5%)
Estimated rent
$1,304/mo
Mortgage (P&I)
−$577
Tax + insurance
−$67
HOA
−$0
Vac / Maint / Mgmt
−$274
Net cashflow
$386/mo
Annual
$4,635/yr
Cap rate
10.51%
Cash-on-cash
15.05%
DSCR
1.67
1% rule
1.19%
Cash to close
$30,800
Investor read
- This is a 1-bed/1.0-bath single-family listed at $110k.
- At list price, monthly cash flow is $386 ($5k/yr) — positive.
- The deal already cash-flows at list — no discount required.
- Meets the 1% rule at list price ($1k rent vs $110k).
- Only 1 days on market — expect competitive offers; lowballing is unlikely to land.
- Local home prices are declining (-3.0%/yr); year-one equity from $761 of loan paydown is wiped out by about $3k of value loss. Plan a longer hold.
- Location reads 52/100 on livability (#693 in NC) — a working-class tenant base; expect higher turnover. Strengths: housing A+, crime A, cost of living B; Watch: amenities F, commute F, employment F.
- Henderson County Schools (suburban): math 48% / reading 52% proficiency, ranked #64 of 178 in NC (top 36%) — acceptable for families but not a draw, mixed tenant base, ~2y average lease.
- Zoned schools: Edneyville Elementary (math 47% / reading 37%, grade F, #633 of 1,410 statewide, top 48%, 439 students, 71% FRL); North Henderson High (math 72% / reading 58%, grade B, #161 of 535 statewide, top 30%, 1,146 students, 61% FRL) — zoned schools average 66% FRL vs 46% district-wide (20 pts higher); higher-poverty schools than district average — tighter screening recommended.
- Watch-outs: built in 1950 — expect roof / HVAC / electrical / plumbing capex.
- Market conditions: Rents rising (+3.6%/yr); 364 active listings in the ZIP; 1,534 units permitted in Henderson County in 2024 (558 in 5+ unit buildings).
- Henderson County population projected at +20% by 2050 — long-run rental-demand tailwind backs the buy-and-hold thesis.
- At projected returns (-3.0% appreciation + 3.6% rent growth), your $31k cash investment doubles in ~8 years — after that, you're playing with house money.
- Cap rate 10.5% vs local median 1.9% in Gerton — top-decile yield for the area; either an underpriced asset or a hidden risk that comps aren't pricing in. Stress-test before assuming the spread holds.
Questions for listing agent
- Built in 1950 — when were the roof, HVAC, electrical panel, plumbing, and water heater last replaced?
- Is there a deadline driving the sale (1031 exchange, divorce, estate, relocation)? That informs how much negotiation room exists.
- Schools are F-rated, which usually means shorter tenancies and higher turnover. Who's the typical renter profile here, and what's been the actual vacancy rate?
- What's the average days-on-market for RENTAL listings here right now (not sales)? A rising rental-DOM trend means longer vacancies and softer asking-rent achievability than the comps imply.
- What's the recent tenant-quality profile in this submarket — average credit score on applications, eviction rate, late-payment / NSF rate, and stable-employment percentage? A property-management company in the area should have these aggregated.
- How much new for-sale + rental construction is in the pipeline within 1–3 miles? Heavy new supply typically softens prices + rents 12–24 months out; constrained supply supports both.
CashFlowRE · CFR-R5JKH65K4MBDC6
· Data 2 days ago
cashflowre.app · 2026-05-29