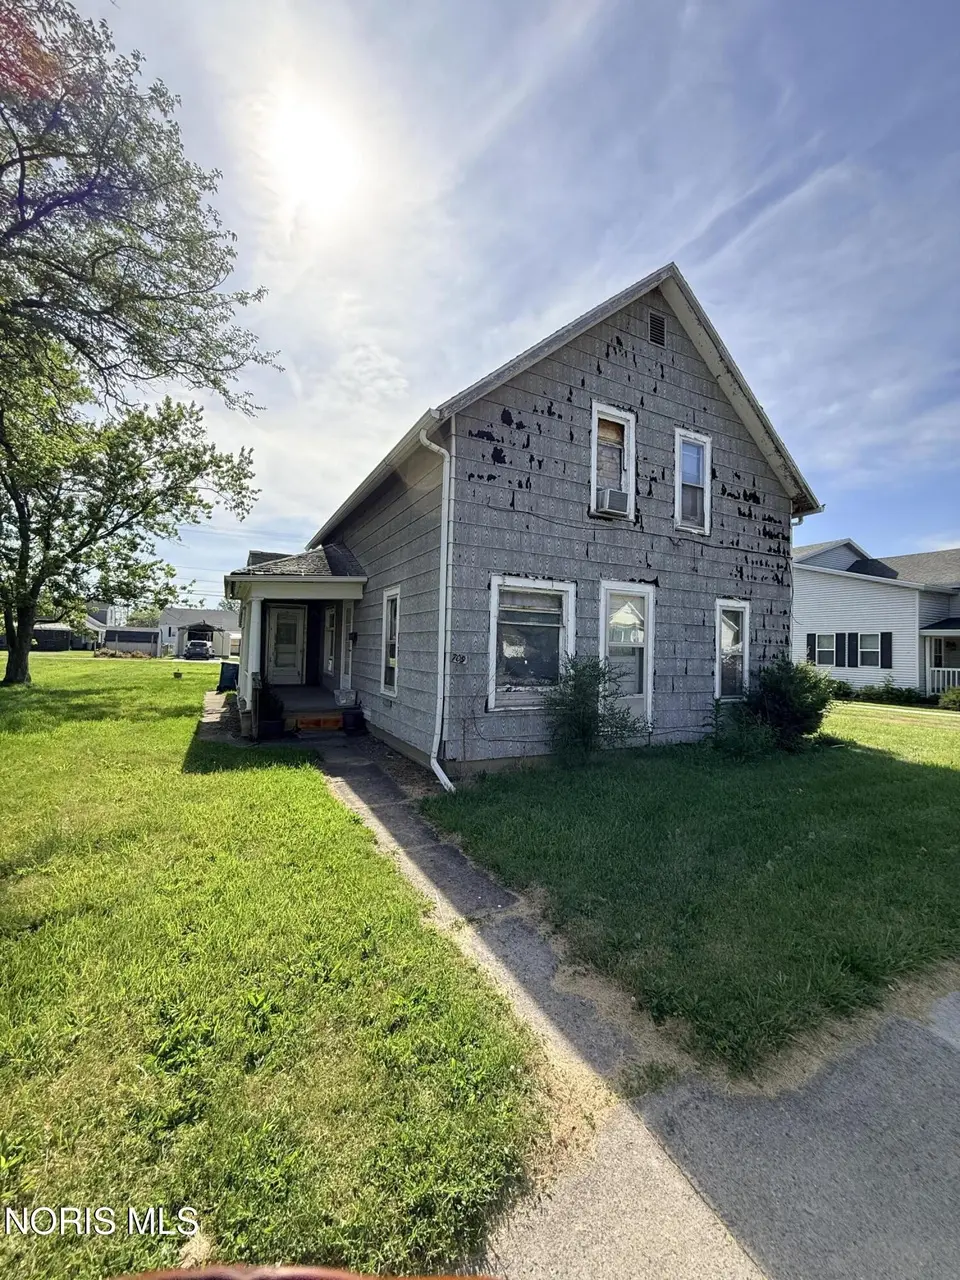
709 S Main St
Bryan, OH 43506
$59,900B
3 bd · 2.0 ba ·
1,336 sqft ·
Built 1925
· MultiFamily
· Coming Soon
· 13 DOM
Cashflow @ list (25.0% down · 7.5%)
Estimated rent
$1,240/mo
Mortgage (P&I)
−$314
Tax + insurance
−$127
HOA
−$0
Vac / Maint / Mgmt
−$260
Net cashflow
$539/mo
Annual
$6,466/yr
Cap rate
17.09%
Cash-on-cash
38.55%
DSCR
2.72
1% rule
2.07%
Cash to close
$16,772
Investor read
- This is a 3-bed/2.0-bath multifamily listed at $60k.
- At list price, monthly cash flow is $539 ($6k/yr) — positive.
- The deal already cash-flows at list — no discount required.
- Meets the 1% rule at list price ($1k rent vs $60k).
- Only 13 days on market — expect competitive offers; lowballing is unlikely to land.
- Local home prices are declining (-3.0%/yr); year-one equity from $414 of loan paydown is wiped out by about $2k of value loss. Plan a longer hold.
- Location reads 78/100 on livability (#170 in OH, #2,623 nationally) — a middle-class / working-renter tenant base. Strengths: crime A+, cost of living A+, housing A+; Watch: employment D+, amenities F, commute F.
- Bryan City (town): math 60% / reading 65% proficiency, ranked #266 of 656 in OH (top 40%) — acceptable for families but not a draw, mixed tenant base, ~2y average lease.
- Zoned schools: Bryan Elementary (math 63% / reading 63%, grade B, #573 of 1,584 statewide, top 37%, 884 students, 31% FRL); Bryan Middle School/High School (math 57% / reading 66%, grade B-, #231 of 781 statewide, top 30%, 936 students, 32% FRL) — zoned schools at 32% FRL track the district average.
- Watch-outs: built in 1925 — expect roof / HVAC / electrical / plumbing capex.
- Market conditions: 63 active listings in the ZIP; 40 units permitted in Williams County in 2024 (0 in 5+ unit buildings).
- Williams County population projected at -14% by 2050 — secular population decline; favor cash flow + early exit over multi-decade hold.
- 2 sale attempts since 10y ago; this cycle's ask is 72% above the opening price — seller raised mid-cycle; expect resistance to lowballs.
- Current owner paid $49k; 22% above their basis — modest negotiation headroom, anchor on the comps not their cost.
- At projected returns (-3.0% appreciation + 3.0% rent growth), your $17k cash investment doubles in ~4 years — after that, you're playing with house money.
- Cap rate 17.1% vs local median 4.1% in Bryan — top-decile yield for the area; either an underpriced asset or a hidden risk that comps aren't pricing in. Stress-test before assuming the spread holds.
Questions for listing agent
- Built in 1925 — when were the roof, HVAC, electrical panel, plumbing, and water heater last replaced?
- Is there a deadline driving the sale (1031 exchange, divorce, estate, relocation)? That informs how much negotiation room exists.
- Schools are A-rated — typically a magnet for longer-tenancy family renters. What's the average tenant stay here, and is there a school-zone premium baked into asking?
- What's the average days-on-market for RENTAL listings here right now (not sales)? A rising rental-DOM trend means longer vacancies and softer asking-rent achievability than the comps imply.
- What's the recent tenant-quality profile in this submarket — average credit score on applications, eviction rate, late-payment / NSF rate, and stable-employment percentage? A property-management company in the area should have these aggregated.
- How much new apartment / multifamily construction is in the pipeline within 1–3 miles? Heavy new supply (>2% of stock underway) typically softens rents 12–24 months out; light construction supports rent growth.
CashFlowRE · CFR-R80S2ZFTEAZ09D
· Data 2 days ago
cashflowre.app · 2026-05-29