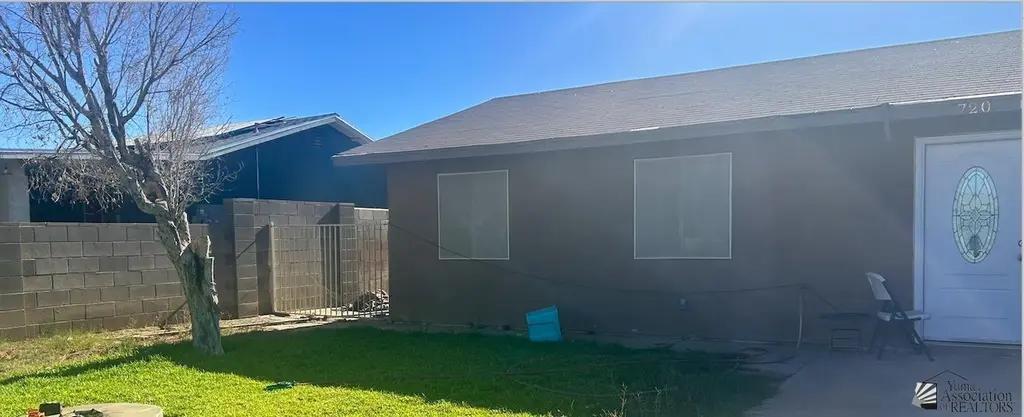
720 N Gladiola Dr
San Luis, AZ 85336
$209,900D
3 bd · 2.0 ba ·
954 sqft ·
Built 1997
· SingleFamily
· Active
· 18 DOM
Cashflow @ list (25.0% down · 7.5%)
Estimated rent
$1,650/mo
Mortgage (P&I)
−$1,101
Tax + insurance
−$136
HOA
−$0
Vac / Maint / Mgmt
−$346
Net cashflow
$67/mo
Annual
$798/yr
Cap rate
6.67%
Cash-on-cash
1.36%
DSCR
1.06
1% rule
0.79%
Cash to close
$58,772
Investor read
- This is a 3-bed/2.0-bath single-family listed at $210k.
- At list price, monthly cash flow is $67 ($798/yr) — positive.
- The deal already cash-flows at list — no discount required.
- To meet the 1% rule (rent ≥ 1% of price), the offer needs to be $165k (21.4% below list).
- It's been on market 18 days — a 2% lower offer ($207k) is reasonable based on typical stale-listing flexibility.
- Recommended offer: $165k (21.4% below list) — sets the bar for 1% rule.
- Local home prices are declining (-3.0%/yr); year-one equity from $1k of loan paydown is wiped out by about $6k of value loss. Plan a longer hold.
- Location reads 76/100 on livability (#13 in AZ, #3,388 nationally) — a middle-class / working-renter tenant base. Strengths: crime A+, cost of living A+, housing A+; Watch: amenities D+, employment D, commute F.
- Yuma Union High School District (4507) (urban): math 14% / reading 16% proficiency, ranked #212 of 249 in AZ (top 85%) — low school quality limits family demand, transient renter base, plan for 1-2y turnover.
- Zoned schools: Desert View Elementary (math 23% / reading 31%, grade F, #600 of 1,109 statewide, top 56%, 757 students, 89% FRL); Southwest Jr. High School (math 20% / reading 20%, grade F, #127 of 218 statewide, top 60%, 679 students, 92% FRL); San Luis High School (math 12% / reading 12%, grade F, #287 of 381 statewide, top 76%, 2,571 students, 59% FRL).
- Market conditions: 116 active listings in the ZIP; 1 comparable units currently listed for rent nearby; 1,399 units permitted in Yuma County in 2024 (180 in 5+ unit buildings).
- Yuma County population projected at +4% by 2050 — modest demand growth; plan on rents tracking national, not racing it.
- Climate carrying-cost: extreme-heat days projected 7→18/yr by 2055 (HVAC capex compounding) — expect insurance premiums to compound above CPI over the hold.
- Cap rate 6.7% vs local median 4.1% in San Luis — top-decile yield for the area; either an underpriced asset or a hidden risk that comps aren't pricing in. Stress-test before assuming the spread holds.
Questions for listing agent
- Is there a deadline driving the sale (1031 exchange, divorce, estate, relocation)? That informs how much negotiation room exists.
- Schools are F-rated, which usually means shorter tenancies and higher turnover. Who's the typical renter profile here, and what's been the actual vacancy rate?
- The area grade is low — what's the realistic commute time and amenity access for the typical tenant pool here? Any planned neighborhood developments (good or bad) we should know about?
- What's the average days-on-market for RENTAL listings here right now (not sales)? A rising rental-DOM trend means longer vacancies and softer asking-rent achievability than the comps imply.
- What's the recent tenant-quality profile in this submarket — average credit score on applications, eviction rate, late-payment / NSF rate, and stable-employment percentage? A property-management company in the area should have these aggregated.
- How much new for-sale + rental construction is in the pipeline within 1–3 miles? Heavy new supply typically softens prices + rents 12–24 months out; constrained supply supports both.
CashFlowRE · CFR-RA6V0KCCV9MKSG
· Data 13 h ago
cashflowre.app · 2026-05-29