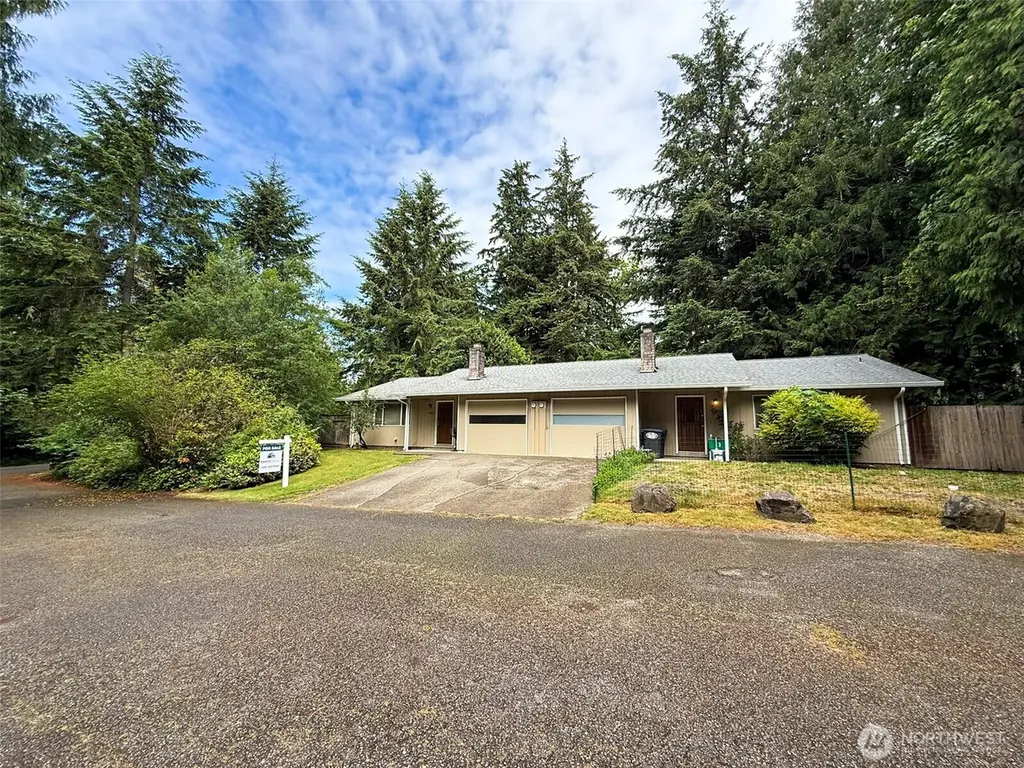
4424 NW Ridgewood Ct Unit A & B
Olympia, WA 98502
$485,000D-
4 bd · 2.0 ba ·
1,860 sqft ·
Built 1976
· Condo
· Active
· 21 DOM
Cashflow @ list (25.0% down · 7.5%)
Estimated rent
$2,893/mo
Mortgage (P&I)
−$2,543
Tax + insurance
−$808
HOA
−$0
Vac / Maint / Mgmt
−$608
Net cashflow
$-1,066/mo
Annual
$-12,792/yr
Cap rate
3.66%
Cash-on-cash
-9.42%
DSCR
0.58
1% rule
0.60%
Cash to close
$135,800
Investor read
- This is a 4-bed/2.0-bath condo listed at $485k.
- At list price, monthly cash flow is $-1k ($-13k/yr) — negative.
- To cash-flow at today's rent, offer at most $331k (31.8% below list).
- To meet the 1% rule (rent ≥ 1% of price), the offer needs to be $289k (40.3% below list).
- It's been on market 21 days — a 2% lower offer ($478k) is reasonable based on typical stale-listing flexibility.
- Recommended offer: $289k (40.3% below list) — sets the bar for 1% rule.
- In year one you build about $52k of equity ($3k loan paydown + $48k appreciation (10.0% local appreciation)).
- Location reads 83/100 on livability (#58 in WA, #1,036 nationally) — a professional / high-income tenant draw. Strengths: amenities A+, commute A+, health & safety A+; Watch: crime F, cost of living D-.
- Olympia School District (urban): math 66% / reading 75% proficiency, ranked #17 of 291 in WA (top 6%) — strong family-tenant draw, lease renewals of 3-5y typical.
- Zoned schools: Leland P Brown Elementary (316 students, 63% FRL); Capital High School (1,326 students, 38% FRL) — zoned schools average 51% FRL vs 25% district-wide (25 pts higher); higher-poverty schools than district average — tighter screening recommended.
- Market conditions: Rents rising (+3.2%/yr); 304 active listings in the ZIP; solid renter incomes; 1,222 units permitted in Thurston County in 2024 (508 in 5+ unit buildings).
- Thurston County population projected at +27% by 2050 — long-run rental-demand tailwind backs the buy-and-hold thesis.
- By year 2, paydown + projected appreciation supports a ~$83k cash-out refi (75% LTV) — recoverable capital for the next deal without selling this one.
- Cap rate 3.7% vs local median 2.4% in Olympia — top-decile yield for the area; either an underpriced asset or a hidden risk that comps aren't pricing in. Stress-test before assuming the spread holds.
- This rent runs 38% of the median local income ($92k/yr) — at the standard rent-burdened threshold; future hikes will face affordability resistance.
Questions for listing agent
- What do current leases actually rent for vs. the listed asking? Can we see a recent rent roll and the last 12 months of T-12 income?
- Built in 1976 — when were the roof, HVAC, electrical panel, plumbing, and water heater last replaced?
- Any open or pending special assessments — roof, HVAC, plumbing, elevator, façade? What's the per-unit balance and payoff schedule, and is the seller paying it off at close or rolling it to the buyer?
- Is there a deadline driving the sale (1031 exchange, divorce, estate, relocation)? That informs how much negotiation room exists.
- Schools are A-rated — typically a magnet for longer-tenancy family renters. What's the average tenant stay here, and is there a school-zone premium baked into asking?
- Crime grade is F in this area — have there been break-ins, vandalism, or insurance claims at this property in the last 3 years? What carrier currently insures it and at what premium?
- The area grade is low — what's the realistic commute time and amenity access for the typical tenant pool here? Any planned neighborhood developments (good or bad) we should know about?
- What's the average days-on-market for RENTAL listings here right now (not sales)? A rising rental-DOM trend means longer vacancies and softer asking-rent achievability than the comps imply.
CashFlowRE · CFR-RARHJEFJ297F03
· Data 3 days ago
cashflowre.app · 2026-05-29