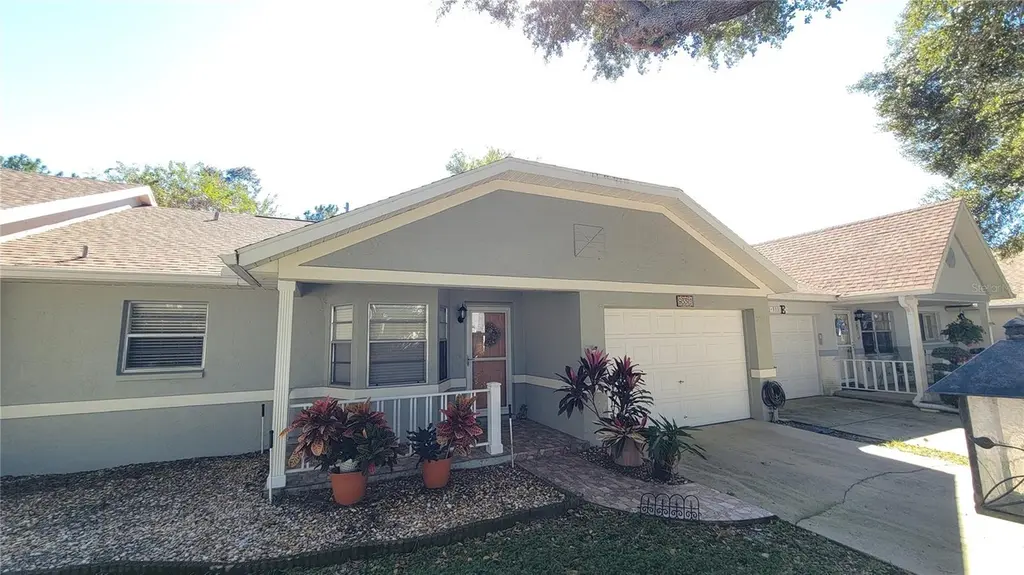
9331 SW 84th Ter Unit D
On Top of the World, FL 34481
$126,000D+
2 bd · 2.0 ba ·
1,151 sqft ·
Built 1993
· Condo
· Active
· 203 DOM
Cashflow @ list (25.0% down · 7.5%)
Estimated rent
$1,569/mo
Mortgage (P&I)
−$661
Tax + insurance
−$111
HOA
−$493
Vac / Maint / Mgmt
−$329
Net cashflow
$-25/mo
Annual
$-301/yr
Cap rate
6.05%
Cash-on-cash
-0.85%
DSCR
0.96
1% rule
1.25%
Cash to close
$35,280
Investor read
- This is a 2-bed/2.0-bath condo listed at $126k.
- At list price, monthly cash flow is $-25 ($-301/yr) — negative.
- To cash-flow at today's rent, offer at most $122k (3.5% below list).
- Meets the 1% rule at list price ($2k rent vs $126k).
- It's been on market 203 days — a 12% lower offer ($111k) is reasonable based on typical stale-listing flexibility.
- Recommended offer: $111k (12.0% below list) — sets the bar for market timing.
- Local home prices are declining (-3.0%/yr); year-one equity from $871 of loan paydown is wiped out by about $4k of value loss. Plan a longer hold.
- Location reads: area grade D — affects rentability + tenant quality, not the cash-flow math above.
- Marion (rural): math 42% / reading 43% proficiency, ranked #61 of 73 in FL (top 84%) — families likely to look elsewhere, expect single-tenant / working-renter base with shorter leases; 61% free/reduced lunch — lower-income household profile, screen leases tightly.
- Watch-outs: HOA is 31% of rent.
- Market conditions: 1151 active listings in the ZIP; 15 comparable units currently listed for rent nearby; rentals at typical pace (median 22d on market — plan ~3-4 weeks tenant-placement turnaround); 7,071 units permitted in Marion County in 2024 (534 in 5+ unit buildings).
- Marion County population projected at +13% by 2050 — modest demand growth; plan on rents tracking national, not racing it.
- 7 sale attempts since 18y ago; this cycle's ask has dropped $14k (10%) from the opening price — seller is motivated, your offer sets the floor, not the list.
- Current owner paid $50k; list at $126k implies a 152% gain — meaningful room to come down on a strong offer.
- Cap rate 6.1% vs local median 2.9% in On Top of the World — top-decile yield for the area; either an underpriced asset or a hidden risk that comps aren't pricing in. Stress-test before assuming the spread holds.
- This rent runs 33% of the median local income ($57k/yr) — at the standard rent-burdened threshold; future hikes will face affordability resistance.
Questions for listing agent
- What do current leases actually rent for vs. the listed asking? Can we see a recent rent roll and the last 12 months of T-12 income?
- It's been on market 203 days. Have you received any prior offers? Is the seller open to a 12% concession, seller financing, or rate buy-down credit?
- What does the HOA fee cover, when was the last increase, and are there any pending special assessments or reserve-fund shortfalls?
- Any open or pending special assessments — roof, HVAC, plumbing, elevator, façade? What's the per-unit balance and payoff schedule, and is the seller paying it off at close or rolling it to the buyer?
- Why hasn't it sold? Are there any deal-killer items the seller is aware of (foundation, flood, title, zoning, code violations)?
- Is there a deadline driving the sale (1031 exchange, divorce, estate, relocation)? That informs how much negotiation room exists.
- The area grade is low — what's the realistic commute time and amenity access for the typical tenant pool here? Any planned neighborhood developments (good or bad) we should know about?
- What's the average days-on-market for RENTAL listings here right now (not sales)? A rising rental-DOM trend means longer vacancies and softer asking-rent achievability than the comps imply.
CashFlowRE · CFR-RCM5V8DKCYQ8G7
· Data 2 days ago
cashflowre.app · 2026-05-29