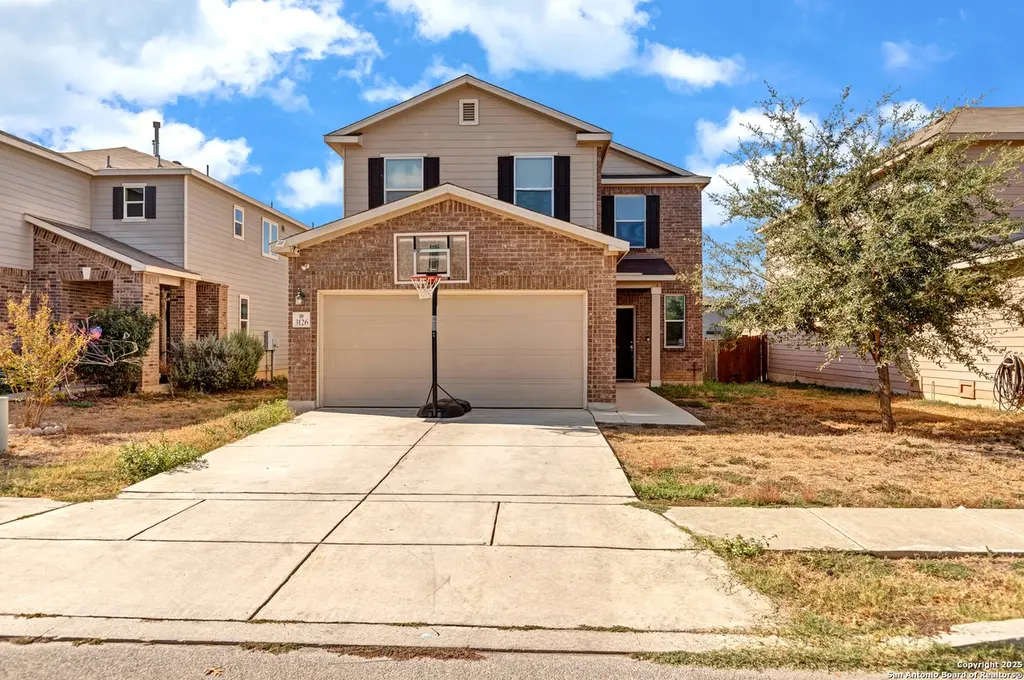
3126 Mission Bell
San Antonio, TX 78224
$210,000C-
5 bd · 2.5 ba ·
2,245 sqft ·
Built 2017
· SingleFamily
· Active
· 105 DOM
Cashflow @ list (25.0% down · 7.5%)
Estimated rent
$2,060/mo
Mortgage (P&I)
−$1,101
Tax + insurance
−$669
HOA
−$29
Vac / Maint / Mgmt
−$433
Net cashflow
$-172/mo
Annual
$-2,068/yr
Cap rate
5.31%
Cash-on-cash
-3.52%
DSCR
0.84
1% rule
0.98%
Cash to close
$58,800
Investor read
- This is a 5-bed/2.5-bath single-family listed at $210k.
- At list price, monthly cash flow is $-172 ($-2k/yr) — negative.
- To cash-flow at today's rent, offer at most $180k (14.5% below list).
- To meet the 1% rule (rent ≥ 1% of price), the offer needs to be $206k (1.9% below list).
- It's been on market 105 days — a 9% lower offer ($191k) is reasonable based on typical stale-listing flexibility.
- Recommended offer: $180k (14.5% below list) — sets the bar for cash-flow.
- In year one you build about $22k of equity ($1k loan paydown + $21k appreciation (10.0% local appreciation)).
- Location reads 80/100 on livability (#31 in TX, #1,616 nationally) — a professional / high-income tenant draw. Strengths: amenities A+, commute A+, cost of living A+; Watch: schools C-, crime F.
- Southwest ISD (rural): math 21% / reading 31% proficiency, ranked #701 of 826 in TX (top 85%) — low school quality limits family demand, transient renter base, plan for 1-2y turnover; 75% free/reduced lunch — lower-income household profile, screen leases tightly.
- Watch-outs: property tax is 3.3% of price.
- Market conditions: Rents flat; 276 active listings in the ZIP; 23 comparable units currently listed for rent nearby; rentals at typical pace (median 25d on market — plan ~3-4 weeks tenant-placement turnaround); 48% of comp listings sitting > 30 days — soft ceiling on asking rent; 8,308 units permitted in Bexar County in 2024 (2,506 in 5+ unit buildings).
- Bexar County population projected at +50% by 2050 — long-run rental-demand tailwind backs the buy-and-hold thesis.
- 2 sale attempts with the ask held roughly flat each time — persistent listings suggest the price (not the market) is what's stuck; bring a comps-based counter.
- By year 2, paydown + projected appreciation supports a ~$36k cash-out refi (75% LTV) — recoverable capital for the next deal without selling this one.
- Climate carrying-cost: severe wind risk, 80% chance of damaging wind over 30y; moderate wildfire risk; extreme-heat days projected 7→23/yr by 2055 (HVAC capex compounding) — expect insurance premiums to compound above CPI over the hold.
- Cap rate 5.3% vs local median 3.8% in San Antonio — top-decile yield for the area; either an underpriced asset or a hidden risk that comps aren't pricing in. Stress-test before assuming the spread holds.
- This rent runs 41% of the median local income ($60k/yr) — at the standard rent-burdened threshold; future hikes will face affordability resistance.
Questions for listing agent
- What do current leases actually rent for vs. the listed asking? Can we see a recent rent roll and the last 12 months of T-12 income?
- It's been on market 105 days. Have you received any prior offers? Is the seller open to a 14% concession, seller financing, or rate buy-down credit?
- Property tax is high relative to price — has the assessment been appealed recently, and will the sale trigger a re-assessment?
- What does the HOA fee cover, when was the last increase, and are there any pending special assessments or reserve-fund shortfalls?
- Why hasn't it sold? Are there any deal-killer items the seller is aware of (foundation, flood, title, zoning, code violations)?
- Is there a deadline driving the sale (1031 exchange, divorce, estate, relocation)? That informs how much negotiation room exists.
- Crime grade is F in this area — have there been break-ins, vandalism, or insurance claims at this property in the last 3 years? What carrier currently insures it and at what premium?
- What's the average days-on-market for RENTAL listings here right now (not sales)? A rising rental-DOM trend means longer vacancies and softer asking-rent achievability than the comps imply.
CashFlowRE · CFR-RFXP9EDVCC61K6
· Data 1 h ago
cashflowre.app · 2026-05-29