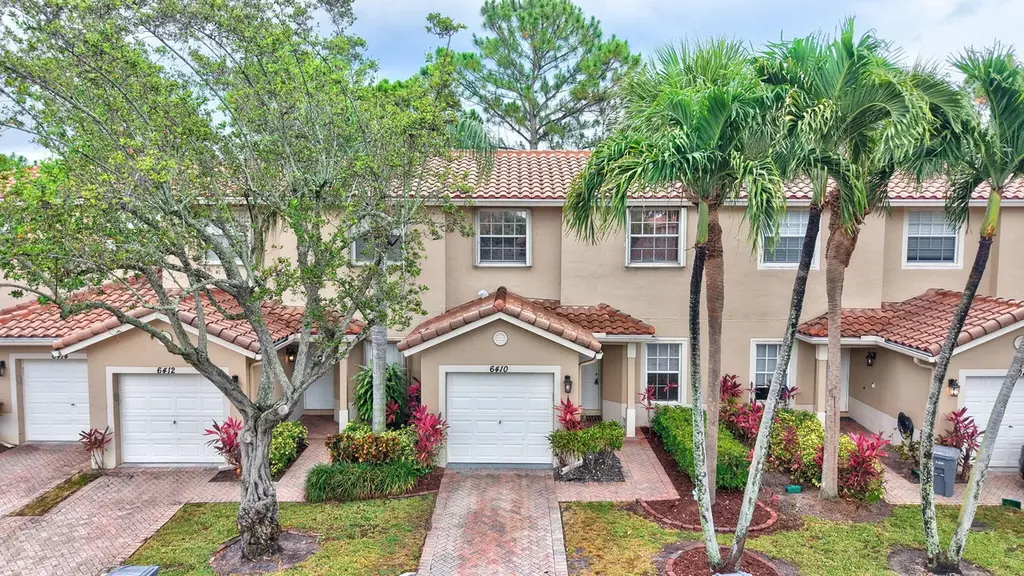
6410 Park Lake Cir
Golf, FL 33437
$346,000D
3 bd · 2.5 ba ·
1,422 sqft ·
Built 2001
· Townhouse
· Active
· 19 DOM
Cashflow @ list (25.0% down · 7.5%)
Estimated rent
$3,278/mo
Mortgage (P&I)
−$1,814
Tax + insurance
−$583
HOA
−$508
Vac / Maint / Mgmt
−$688
Net cashflow
$-315/mo
Annual
$-3,785/yr
Cap rate
5.20%
Cash-on-cash
-3.91%
DSCR
0.83
1% rule
0.95%
Cash to close
$96,880
Investor read
- This is a 3-bed/2.5-bath townhouse listed at $346k.
- At list price, monthly cash flow is $-315 ($-4k/yr) — negative.
- To cash-flow at today's rent, offer at most $290k (16.1% below list).
- To meet the 1% rule (rent ≥ 1% of price), the offer needs to be $328k (5.3% below list).
- It's been on market 19 days — a 2% lower offer ($341k) is reasonable based on typical stale-listing flexibility.
- Recommended offer: $290k (16.1% below list) — sets the bar for cash-flow.
- In year one you build about $2k of equity ($2k loan paydown + $-836 appreciation (-0.2% local appreciation)).
- Location reads 63/100 on livability (#703 in FL) — a middle-class / working-renter tenant base. Strengths: crime A+, employment A+, housing A+; Watch: amenities F, commute F, cost of living F.
- Palm Beach (suburban): math 46% / reading 53% proficiency, ranked #34 of 73 in FL (top 47%) — families likely to look elsewhere, expect single-tenant / working-renter base with shorter leases.
- Zoned schools: Hagen Road Elementary School (math 55% / reading 63%, grade B-, #722 of 2,144 statewide, top 34%, 773 students, 46% FRL); Boynton Beach Community High (math 13% / reading 25%, grade F, #565 of 667 statewide, top 85%, 1,547 students, 65% FRL) — zoned schools at 56% FRL track the district average.
- Market conditions: Rents rising (+1.3%/yr); 479 active listings in the ZIP; 39 comparable units currently listed for rent nearby; rentals at typical pace (median 25d on market — plan ~3-4 weeks tenant-placement turnaround); solid renter incomes; 3,974 units permitted in Palm Beach County in 2024 (1,012 in 5+ unit buildings).
- Palm Beach County population projected at +30% by 2050 — long-run rental-demand tailwind backs the buy-and-hold thesis.
- 3 sale attempts since 12y ago with the ask held roughly flat each time — persistent listings suggest the price (not the market) is what's stuck; bring a comps-based counter.
- Current owner paid $164k; list at $346k implies a 111% gain — meaningful room to come down on a strong offer.
- Climate carrying-cost: severe wind risk, 99% chance of damaging wind over 30y; extreme-heat days projected 5→17/yr by 2055 (HVAC capex compounding) — expect insurance premiums to compound above CPI over the hold.
- At $3,278/mo this rent would consume 49% of the median local household income ($81k/yr) (locally 902% of renters already pay >50% of income on rent) — very limited rent-growth headroom before tenants either downsize or default.
Questions for listing agent
- What do current leases actually rent for vs. the listed asking? Can we see a recent rent roll and the last 12 months of T-12 income?
- What does the HOA fee cover, when was the last increase, and are there any pending special assessments or reserve-fund shortfalls?
- Is there a deadline driving the sale (1031 exchange, divorce, estate, relocation)? That informs how much negotiation room exists.
- The area grade is low — what's the realistic commute time and amenity access for the typical tenant pool here? Any planned neighborhood developments (good or bad) we should know about?
- What's the average days-on-market for RENTAL listings here right now (not sales)? A rising rental-DOM trend means longer vacancies and softer asking-rent achievability than the comps imply.
- What's the recent tenant-quality profile in this submarket — average credit score on applications, eviction rate, late-payment / NSF rate, and stable-employment percentage? A property-management company in the area should have these aggregated.
- How much new for-sale + rental construction is in the pipeline within 1–3 miles? Heavy new supply typically softens prices + rents 12–24 months out; constrained supply supports both.
CashFlowRE · CFR-RGXHB7F7WHMYTQ
· Data 2 days ago
cashflowre.app · 2026-05-29