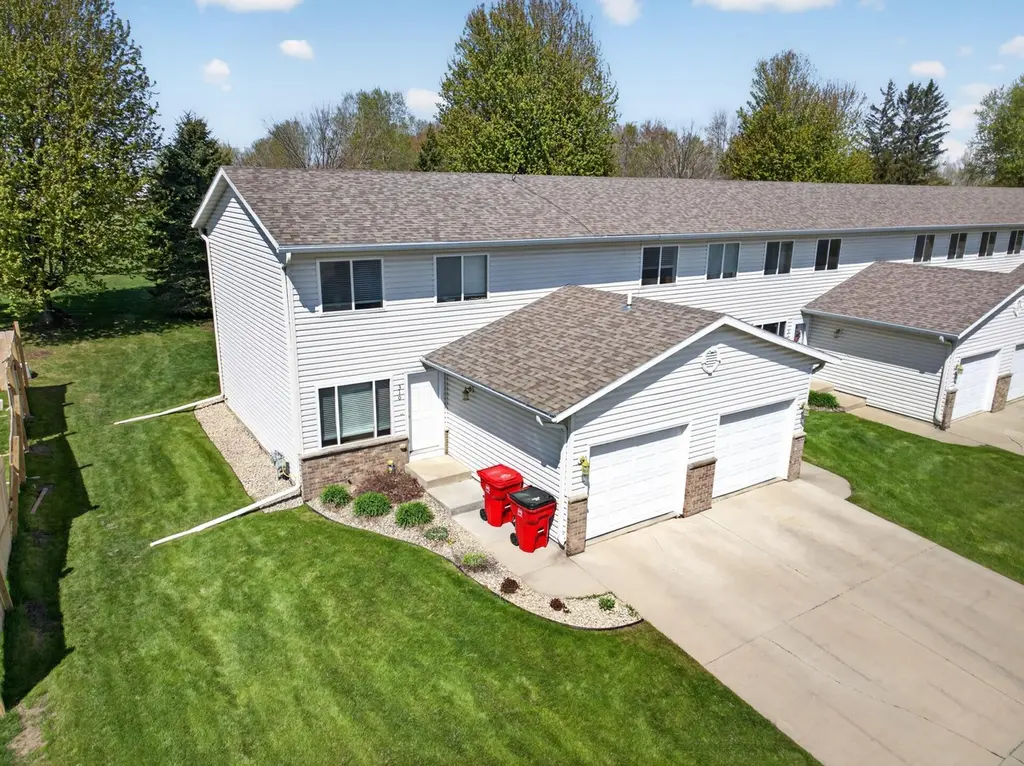
310 10th Ave NW
Byron, MN 55920
$232,900D
3 bd · 1.5 ba ·
1,488 sqft ·
Built 2002
· Townhouse
· Active
· 31 DOM
Cashflow @ list (25.0% down · 7.5%)
Estimated rent
$2,108/mo
Mortgage (P&I)
−$1,221
Tax + insurance
−$354
HOA
−$163
Vac / Maint / Mgmt
−$443
Net cashflow
$-73/mo
Annual
$-874/yr
Cap rate
5.92%
Cash-on-cash
-1.34%
DSCR
0.94
1% rule
0.90%
Cash to close
$65,212
Investor read
- This is a 3-bed/1.5-bath townhouse listed at $233k.
- At list price, monthly cash flow is $-73 ($-874/yr) — negative.
- To cash-flow at today's rent, offer at most $220k (5.5% below list).
- To meet the 1% rule (rent ≥ 1% of price), the offer needs to be $211k (9.5% below list).
- It's been on market 31 days — a 3% lower offer ($226k) is reasonable based on typical stale-listing flexibility.
- Recommended offer: $211k (9.5% below list) — sets the bar for 1% rule.
- Local home prices are declining (-3.0%/yr); year-one equity from $2k of loan paydown is wiped out by about $7k of value loss. Plan a longer hold.
- Location reads 83/100 on livability (#30 in MN, #956 nationally) — a professional / high-income tenant draw. Strengths: commute A+, employment A+, housing A+; Watch: amenities F, health & safety D-.
- Byron Public School District (town): math 60% / reading 63% proficiency, ranked #24 of 301 in MN (top 8%) — acceptable for families but not a draw, mixed tenant base, ~2y average lease; only 10% free/reduced lunch — higher-income household profile.
- Zoned schools: Byron Intermediate School (math 76% / reading 66%, grade A-, #62 of 857 statewide, top 8%, 553 students, 14% FRL); Byron Middle School (math 53% / reading 58%, grade B-, #43 of 258 statewide, top 17%, 543 students, 15% FRL); Byron Senior High School (math 32% / reading 72%, grade D+, #111 of 471 statewide, top 26%, 664 students, 14% FRL) — zoned schools at 15% FRL track the district average.
- Market conditions: 161 active listings in the ZIP; 2 comparable units currently listed for rent nearby; 1,267 units permitted in Olmsted County in 2024 (915 in 5+ unit buildings).
- Olmsted County population projected at +16% by 2050 — long-run rental-demand tailwind backs the buy-and-hold thesis.
- 9 sale attempts since 21y ago with the ask held roughly flat each time — persistent listings suggest the price (not the market) is what's stuck; bring a comps-based counter.
- Cap rate 5.9% vs local median 2.5% in Byron — top-decile yield for the area; either an underpriced asset or a hidden risk that comps aren't pricing in. Stress-test before assuming the spread holds.
Questions for listing agent
- What do current leases actually rent for vs. the listed asking? Can we see a recent rent roll and the last 12 months of T-12 income?
- It's been on market 31 days. Have you received any prior offers? Is the seller open to a 10% concession, seller financing, or rate buy-down credit?
- What does the HOA fee cover, when was the last increase, and are there any pending special assessments or reserve-fund shortfalls?
- Is there a deadline driving the sale (1031 exchange, divorce, estate, relocation)? That informs how much negotiation room exists.
- Schools are A-rated — typically a magnet for longer-tenancy family renters. What's the average tenant stay here, and is there a school-zone premium baked into asking?
- The area grade is low — what's the realistic commute time and amenity access for the typical tenant pool here? Any planned neighborhood developments (good or bad) we should know about?
- What's the average days-on-market for RENTAL listings here right now (not sales)? A rising rental-DOM trend means longer vacancies and softer asking-rent achievability than the comps imply.
- What's the recent tenant-quality profile in this submarket — average credit score on applications, eviction rate, late-payment / NSF rate, and stable-employment percentage? A property-management company in the area should have these aggregated.
CashFlowRE · CFR-RH7MMK0PVM57E3
· Data 1 day ago
cashflowre.app · 2026-05-29