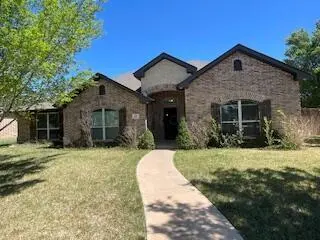
8111 Tallahassee Dr
Amarillo, TX 79118
$289,000D-
4 bd · 2.0 ba ·
2,186 sqft ·
Built 2012
· SingleFamily
· Pending
· 5 DOM
Cashflow @ list (25.0% down · 7.5%)
Estimated rent
$2,603/mo
Mortgage (P&I)
−$1,516
Tax + insurance
−$710
HOA
−$0
Vac / Maint / Mgmt
−$547
Net cashflow
$-169/mo
Annual
$-2,025/yr
Cap rate
5.59%
Cash-on-cash
-2.50%
DSCR
0.89
1% rule
0.90%
Cash to close
$80,920
Investor read
- This is a 4-bed/2.0-bath single-family listed at $289k.
- At list price, monthly cash flow is $-169 ($-2k/yr) — negative.
- To cash-flow at today's rent, offer at most $259k (10.3% below list).
- To meet the 1% rule (rent ≥ 1% of price), the offer needs to be $260k (9.9% below list).
- Only 5 days on market — expect competitive offers; lowballing is unlikely to land.
- Recommended offer: $259k (10.3% below list) — sets the bar for cash-flow.
- Local home prices are declining (-3.0%/yr); year-one equity from $2k of loan paydown is wiped out by about $9k of value loss. Plan a longer hold.
- Location reads 66/100 on livability (#624 in TX) — a middle-class / working-renter tenant base. Strengths: cost of living A+, housing A+; Watch: amenities C-, crime F, commute F.
- Canyon ISD (town): math 60% / reading 54% proficiency, ranked #78 of 826 in TX (top 9%) — acceptable for families but not a draw, mixed tenant base, ~2y average lease.
- Zoned schools: City View El (math 43% / reading 39%, grade F, #1,462 of 4,322 statewide, top 34%, 628 students, 44% FRL); Canyon H S (math 63% / reading 68%, grade B, #193 of 1,632 statewide, top 12%, 1,082 students, 24% FRL).
- Market conditions: Rents rising fast (+5.5%/yr); 276 active listings in the ZIP; 5 comparable units currently listed for rent nearby; rentals at typical pace (median 21d on market — plan ~3-4 weeks tenant-placement turnaround); 40% of comp listings sitting > 30 days — soft ceiling on asking rent; solid renter incomes; 45 units permitted in Randall County in 2024 (0 in 5+ unit buildings).
- Randall County population projected at +36% by 2050 — long-run rental-demand tailwind backs the buy-and-hold thesis.
- 2 sale attempts since 4y ago with the ask held roughly flat each time — persistent listings suggest the price (not the market) is what's stuck; bring a comps-based counter.
- Climate carrying-cost: severe wildfire risk — expect insurance premiums to compound above CPI over the hold.
- This rent runs 36% of the median local income ($88k/yr) — at the standard rent-burdened threshold; future hikes will face affordability resistance.
Questions for listing agent
- What do current leases actually rent for vs. the listed asking? Can we see a recent rent roll and the last 12 months of T-12 income?
- Is there a deadline driving the sale (1031 exchange, divorce, estate, relocation)? That informs how much negotiation room exists.
- Schools are D-rated, which usually means shorter tenancies and higher turnover. Who's the typical renter profile here, and what's been the actual vacancy rate?
- Crime grade is F in this area — have there been break-ins, vandalism, or insurance claims at this property in the last 3 years? What carrier currently insures it and at what premium?
- The area grade is low — what's the realistic commute time and amenity access for the typical tenant pool here? Any planned neighborhood developments (good or bad) we should know about?
- What's the average days-on-market for RENTAL listings here right now (not sales)? A rising rental-DOM trend means longer vacancies and softer asking-rent achievability than the comps imply.
- What's the recent tenant-quality profile in this submarket — average credit score on applications, eviction rate, late-payment / NSF rate, and stable-employment percentage? A property-management company in the area should have these aggregated.
- How much new for-sale + rental construction is in the pipeline within 1–3 miles? Heavy new supply typically softens prices + rents 12–24 months out; constrained supply supports both.
CashFlowRE · CFR-RJC80X60AZR2JR
· Data 3 weeks ago
cashflowre.app · 2026-05-29