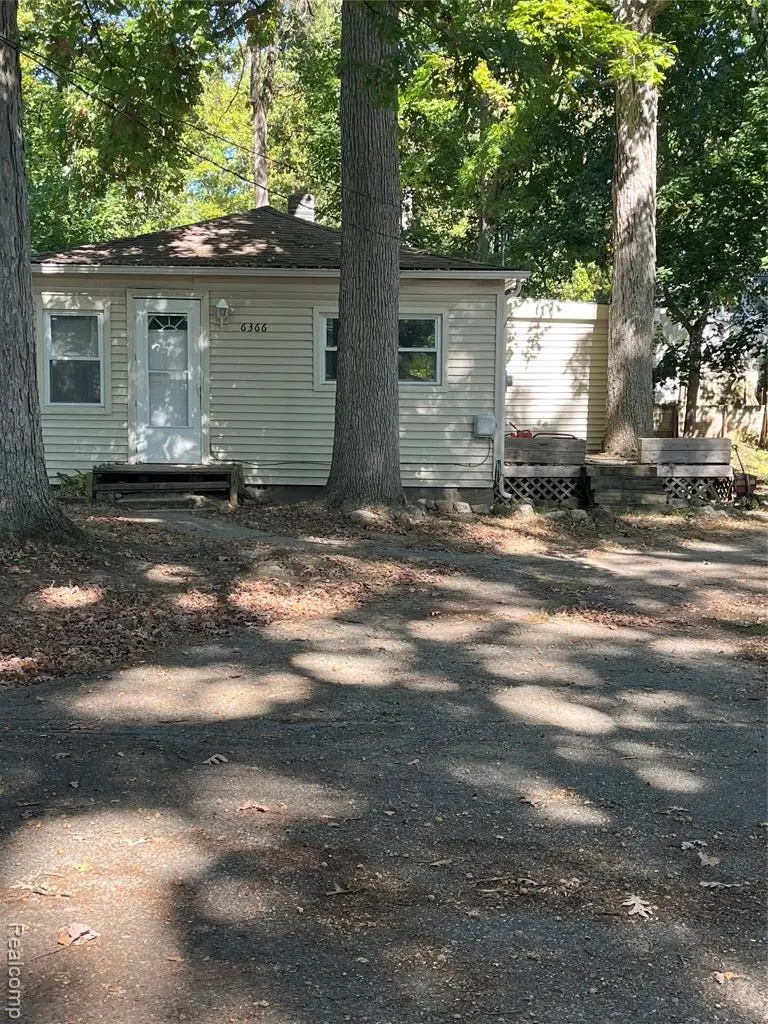
6366 Dellwood Dr
Village of Clarkston, MI 48329
$234,900D-
2 bd · 1.0 ba ·
1,016 sqft ·
Built 1938
· SingleFamily
· Pending
· 17 DOM
Cashflow @ list (25.0% down · 7.5%)
Estimated rent
$1,617/mo
Mortgage (P&I)
−$1,232
Tax + insurance
−$229
HOA
−$35
Vac / Maint / Mgmt
−$340
Net cashflow
$-219/mo
Annual
$-2,622/yr
Cap rate
5.18%
Cash-on-cash
-3.99%
DSCR
0.82
1% rule
0.69%
Cash to close
$65,772
Investor read
- This is a 2-bed/1.0-bath single-family listed at $235k.
- At list price, monthly cash flow is $-219 ($-3k/yr) — negative.
- To cash-flow at today's rent, offer at most $196k (16.4% below list).
- To meet the 1% rule (rent ≥ 1% of price), the offer needs to be $162k (31.1% below list).
- It's been on market 17 days — a 2% lower offer ($231k) is reasonable based on typical stale-listing flexibility.
- Recommended offer: $162k (31.1% below list) — sets the bar for 1% rule.
- Local home prices are declining (-3.0%/yr); year-one equity from $2k of loan paydown is wiped out by about $7k of value loss. Plan a longer hold.
- Location reads 79/100 on livability (#98 in MI, #2,255 nationally) — a middle-class / working-renter tenant base. Strengths: schools A+, crime A+, employment A+; Watch: amenities F, commute F.
- Waterford School District (suburban): math 26% / reading 42% proficiency, ranked #285 of 540 in MI (top 53%) — families likely to look elsewhere, expect single-tenant / working-renter base with shorter leases.
- Watch-outs: built in 1938 — expect roof / HVAC / electrical / plumbing capex.
- Market conditions: 130 active listings in the ZIP; 5 comparable units currently listed for rent nearby; rentals leasing fast (median 12d on market — plan ~1-2 weeks tenant-placement turnaround); solid renter incomes; 2,614 units permitted in Oakland County in 2024 (721 in 5+ unit buildings).
- Oakland County population projected at +10% by 2050 — modest demand growth; plan on rents tracking national, not racing it.
- 13 sale attempts since 20y ago; this cycle's ask is 4% above the opening price — seller raised mid-cycle; expect resistance to lowballs.
- Current owner paid $117k; list at $235k implies a 101% gain — meaningful room to come down on a strong offer.
- Cap rate 5.2% vs local median 3.9% in Village of Clarkston — top-decile yield for the area; either an underpriced asset or a hidden risk that comps aren't pricing in. Stress-test before assuming the spread holds.
Questions for listing agent
- What do current leases actually rent for vs. the listed asking? Can we see a recent rent roll and the last 12 months of T-12 income?
- Built in 1938 — when were the roof, HVAC, electrical panel, plumbing, and water heater last replaced?
- What does the HOA fee cover, when was the last increase, and are there any pending special assessments or reserve-fund shortfalls?
- Is there a deadline driving the sale (1031 exchange, divorce, estate, relocation)? That informs how much negotiation room exists.
- Schools are A-rated — typically a magnet for longer-tenancy family renters. What's the average tenant stay here, and is there a school-zone premium baked into asking?
- The area grade is low — what's the realistic commute time and amenity access for the typical tenant pool here? Any planned neighborhood developments (good or bad) we should know about?
- What's the average days-on-market for RENTAL listings here right now (not sales)? A rising rental-DOM trend means longer vacancies and softer asking-rent achievability than the comps imply.
- What's the recent tenant-quality profile in this submarket — average credit score on applications, eviction rate, late-payment / NSF rate, and stable-employment percentage? A property-management company in the area should have these aggregated.
CashFlowRE · CFR-RJZBCT95BJ3MF8
· Data 2 weeks ago
cashflowre.app · 2026-05-29