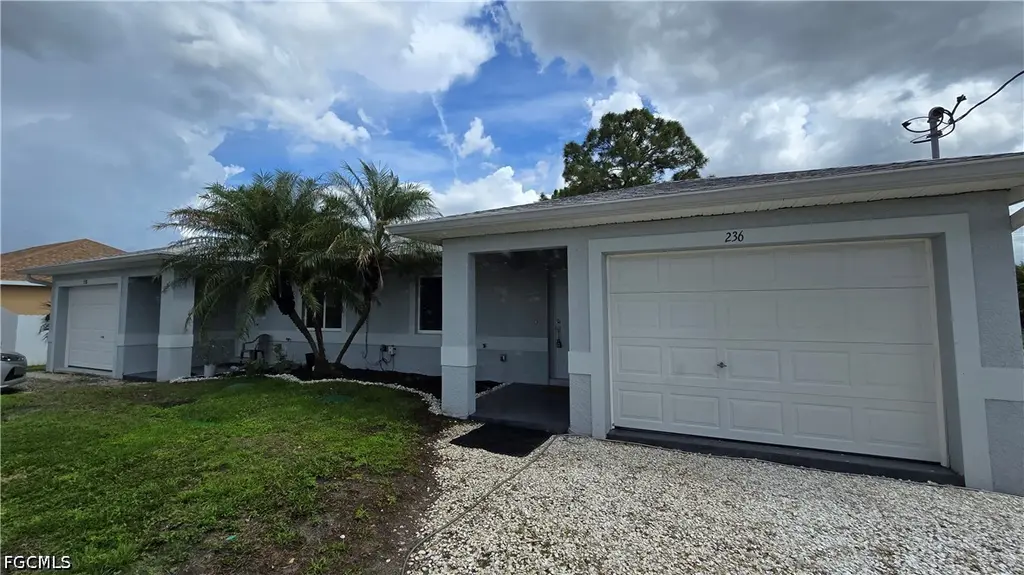
236/238 Peerless St
Lehigh Acres, FL 33974
$395,000C
6 bd · 4.0 ba ·
2,330 sqft ·
Built 2006
· MultiFamily
· Pending
· 60 DOM
Cashflow @ list (25.0% down · 7.5%)
Estimated rent
$3,433/mo
Mortgage (P&I)
−$2,071
Tax + insurance
−$658
HOA
−$0
Vac / Maint / Mgmt
−$721
Net cashflow
$-18/mo
Annual
$-212/yr
Cap rate
6.24%
Cash-on-cash
-0.19%
DSCR
0.99
1% rule
0.87%
Cash to close
$110,600
Investor read
- This is a 2 × 2-bed/1.5-bath units multifamily listed at $395k. Condition is rated good.
- At list price, monthly cash flow is $-18 ($-212/yr) — negative. Per door: $-9/mo.
- To cash-flow at today's rent, offer at most $392k (0.6% below list).
- To meet the 1% rule (rent ≥ 1% of price), the offer needs to be $343k (13.1% below list).
- It's been on market 60 days — a 3% lower offer ($383k) is reasonable based on typical stale-listing flexibility.
- Recommended offer: $343k (13.1% below list) — sets the bar for 1% rule.
- In year one you build about $42k of equity ($3k loan paydown + $40k appreciation (10.0% local appreciation)).
- Location reads 59/100 on livability (#826 in FL) — a working-class tenant base; expect higher turnover. Strengths: cost of living A+, housing A+; Watch: crime C-, employment D+, schools D-.
- Lee (suburban): math 47% / reading 50% proficiency, ranked #42 of 73 in FL (top 58%) — families likely to look elsewhere, expect single-tenant / working-renter base with shorter leases.
- Market conditions: Rents falling (-4.7%/yr); 2460 active listings in the ZIP; 6 comparable units currently listed for rent nearby; rentals at typical pace (median 22d on market — plan ~3-4 weeks tenant-placement turnaround); 15,411 units permitted in Lee County in 2024 (4,686 in 5+ unit buildings).
- Lee County population projected at +44% by 2050 — long-run rental-demand tailwind backs the buy-and-hold thesis.
- At projected returns (10.0% appreciation + 0.0% rent growth), your $111k cash investment doubles in ~3 years — after that, you're playing with house money.
- By year 2, paydown + projected appreciation supports a ~$68k cash-out refi (75% LTV) — recoverable capital for the next deal without selling this one.
- Climate carrying-cost: severe wind risk, 99% chance of damaging wind over 30y; extreme-heat days projected 7→29/yr by 2055 (HVAC capex compounding) — expect insurance premiums to compound above CPI over the hold.
- Cap rate 6.2% vs local median 4.7% in Lehigh Acres — top-decile yield for the area; either an underpriced asset or a hidden risk that comps aren't pricing in. Stress-test before assuming the spread holds.
- At $3,433/mo this rent would consume 57% of the median local household income ($72k/yr) (locally 434% of renters already pay >50% of income on rent) — very limited rent-growth headroom before tenants either downsize or default.
Questions for listing agent
- What do current leases actually rent for vs. the listed asking? Can we see a recent rent roll and the last 12 months of T-12 income?
- It's been on market 60 days. Have you received any prior offers? Is the seller open to a 13% concession, seller financing, or rate buy-down credit?
- Can we see the unit-by-unit rent roll, current vacancy, and any below-market leases? What's the average tenancy length?
- What capital expenditures (roof, boiler, parking lot, exteriors) have been made in the last 5 years, and what's planned in the next 2?
- Is there a deadline driving the sale (1031 exchange, divorce, estate, relocation)? That informs how much negotiation room exists.
- Schools are D-rated, which usually means shorter tenancies and higher turnover. Who's the typical renter profile here, and what's been the actual vacancy rate?
- What's the average days-on-market for RENTAL listings here right now (not sales)? A rising rental-DOM trend means longer vacancies and softer asking-rent achievability than the comps imply.
- What's the recent tenant-quality profile in this submarket — average credit score on applications, eviction rate, late-payment / NSF rate, and stable-employment percentage? A property-management company in the area should have these aggregated.
CashFlowRE · CFR-RJZK558M4VK6TM
· Data 3 weeks ago
cashflowre.app · 2026-05-29