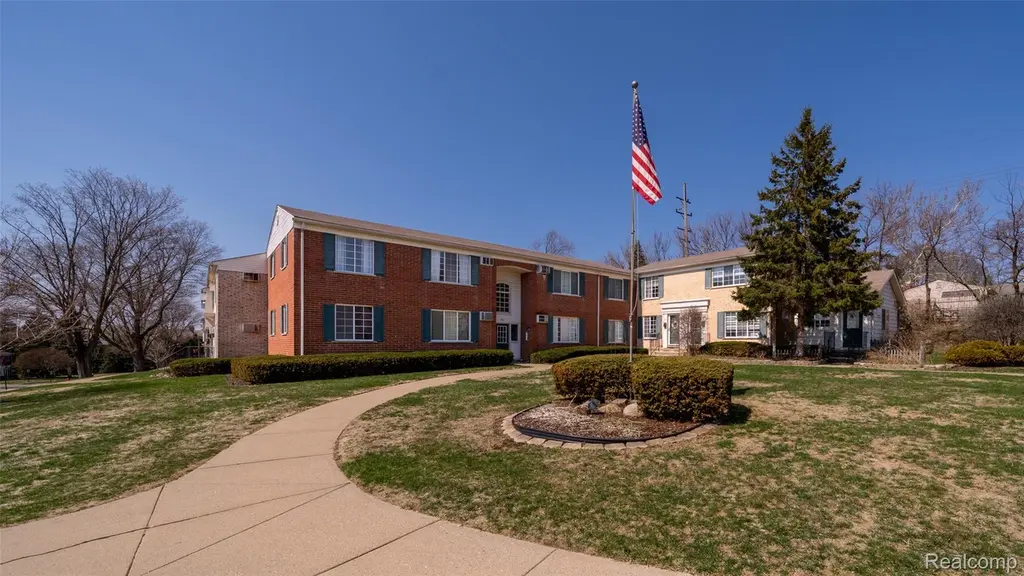
451 Miller Ave #211
Rochester, MI 48307
$146,000D+
2 bd · 1.0 ba ·
751 sqft ·
Built 1966
· Condo
· Pending
· 27 DOM
Cashflow @ list (25.0% down · 7.5%)
Estimated rent
$1,559/mo
Mortgage (P&I)
−$766
Tax + insurance
−$175
HOA
−$320
Vac / Maint / Mgmt
−$327
Net cashflow
$-29/mo
Annual
$-352/yr
Cap rate
6.05%
Cash-on-cash
-0.86%
DSCR
0.96
1% rule
1.07%
Cash to close
$40,880
Investor read
- This is a 2-bed/1.0-bath condo listed at $146k.
- At list price, monthly cash flow is $-29 ($-352/yr) — negative.
- To cash-flow at today's rent, offer at most $141k (3.6% below list).
- Meets the 1% rule at list price ($2k rent vs $146k).
- It's been on market 27 days — a 2% lower offer ($144k) is reasonable based on typical stale-listing flexibility.
- Recommended offer: $141k (3.6% below list) — sets the bar for cash-flow.
- Local home prices are declining (-3.0%/yr); year-one equity from $1k of loan paydown is wiped out by about $4k of value loss. Plan a longer hold.
- Location reads 76/100 on livability (#150 in MI, #3,744 nationally) — a middle-class / working-renter tenant base. Strengths: crime A+, employment A+, housing A+; Watch: cost of living D+, amenities D, health & safety D.
- Rochester Community School District (suburban): math 60% / reading 69% proficiency, ranked #21 of 540 in MI (top 4%) — acceptable for families but not a draw, mixed tenant base, ~2y average lease; only 10% free/reduced lunch — higher-income household profile.
- Watch-outs: HOA is 21% of rent.
- Market conditions: Rents rising (+1.8%/yr); 208 active listings in the ZIP; 17 comparable units currently listed for rent nearby; rentals lingering (median 44d on market — plan ~5-8 weeks vacancy on turnover, expect pricing pressure); 53% of comp listings sitting > 30 days — soft ceiling on asking rent; solid renter incomes; 2,614 units permitted in Oakland County in 2024 (721 in 5+ unit buildings).
- Oakland County population projected at +10% by 2050 — modest demand growth; plan on rents tracking national, not racing it.
- 7 sale attempts with the ask held roughly flat each time — persistent listings suggest the price (not the market) is what's stuck; bring a comps-based counter.
- Current owner paid $95k; list at $146k implies a 54% gain — meaningful room to come down on a strong offer.
- Cap rate 6.1% vs local median 2.2% in Rochester — top-decile yield for the area; either an underpriced asset or a hidden risk that comps aren't pricing in. Stress-test before assuming the spread holds.
- This rent is only 18% of the median local income ($107k/yr) — well below the 30% rent-burden line; pricing power to push rent on renewal without tenant pushback.
Questions for listing agent
- What do current leases actually rent for vs. the listed asking? Can we see a recent rent roll and the last 12 months of T-12 income?
- Built in 1966 — when were the roof, HVAC, electrical panel, plumbing, and water heater last replaced?
- What does the HOA fee cover, when was the last increase, and are there any pending special assessments or reserve-fund shortfalls?
- Any open or pending special assessments — roof, HVAC, plumbing, elevator, façade? What's the per-unit balance and payoff schedule, and is the seller paying it off at close or rolling it to the buyer?
- Is there a deadline driving the sale (1031 exchange, divorce, estate, relocation)? That informs how much negotiation room exists.
- Schools are A-rated — typically a magnet for longer-tenancy family renters. What's the average tenant stay here, and is there a school-zone premium baked into asking?
- The area grade is low — what's the realistic commute time and amenity access for the typical tenant pool here? Any planned neighborhood developments (good or bad) we should know about?
- What's the average days-on-market for RENTAL listings here right now (not sales)? A rising rental-DOM trend means longer vacancies and softer asking-rent achievability than the comps imply.
CashFlowRE · CFR-RKNDJGBAJCPJ47
· Data 2 days ago
cashflowre.app · 2026-05-29