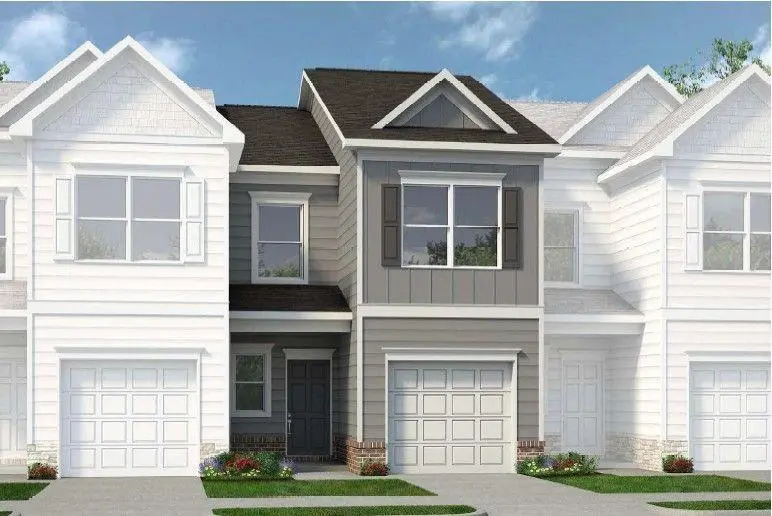
158 Oconee Rd #272
Cartersville, GA 30120
$234,750F
3 bd · 2.5 ba ·
1,443 sqft ·
Built 2026
· Townhouse
· Active
· 57 DOM
Cashflow @ list (25.0% down · 7.5%)
Estimated rent
$1,791/mo
Mortgage (P&I)
−$1,231
Tax + insurance
−$391
HOA
−$104
Vac / Maint / Mgmt
−$376
Net cashflow
$-312/mo
Annual
$-3,740/yr
Cap rate
4.70%
Cash-on-cash
-5.69%
DSCR
0.75
1% rule
0.76%
Cash to close
$65,730
Investor read
- This is a 3-bed/2.5-bath townhouse listed at $235k. Condition is rated good.
- At list price, monthly cash flow is $-312 ($-4k/yr) — negative.
- To cash-flow at today's rent, offer at most $190k (19.2% below list).
- To meet the 1% rule (rent ≥ 1% of price), the offer needs to be $179k (23.7% below list).
- It's been on market 57 days — a 3% lower offer ($228k) is reasonable based on typical stale-listing flexibility.
- Recommended offer: $179k (23.7% below list) — sets the bar for 1% rule.
- Local home prices are declining (-3.0%/yr); year-one equity from $2k of loan paydown is wiped out by about $7k of value loss. Plan a longer hold.
- Location reads 74/100 on livability (#43 in GA, #4,800 nationally) — a middle-class / working-renter tenant base. Strengths: housing A+, health & safety A+, amenities A; Watch: schools D+, commute F.
- Paulding County (suburban): math 39% / reading 42% proficiency, ranked #33 of 174 in GA (top 19%) — families likely to look elsewhere, expect single-tenant / working-renter base with shorter leases.
- Market conditions: Rents soft (-0.2%/yr); 521 active listings in the ZIP; 1 comparable units currently listed for rent nearby; solid renter incomes; 1,458 units permitted in Paulding County in 2024 (0 in 5+ unit buildings).
- Paulding County population projected at +24% by 2050 — long-run rental-demand tailwind backs the buy-and-hold thesis.
- 2 sale attempts; this cycle's ask has dropped $15k (6%) from the opening price — seller is motivated, your offer sets the floor, not the list.
- Climate carrying-cost: major wildfire risk; extreme-heat days projected 7→18/yr by 2055 (HVAC capex compounding) — expect insurance premiums to compound above CPI over the hold.
- Cap rate 4.7% vs local median 3.7% in Cartersville — meaningfully above typical; check what's discounted (condition, days-on-market, listing class) to confirm the premium yield is real.
Questions for listing agent
- What do current leases actually rent for vs. the listed asking? Can we see a recent rent roll and the last 12 months of T-12 income?
- It's been on market 57 days. Have you received any prior offers? Is the seller open to a 24% concession, seller financing, or rate buy-down credit?
- What does the HOA fee cover, when was the last increase, and are there any pending special assessments or reserve-fund shortfalls?
- Is there a deadline driving the sale (1031 exchange, divorce, estate, relocation)? That informs how much negotiation room exists.
- Schools are D-rated, which usually means shorter tenancies and higher turnover. Who's the typical renter profile here, and what's been the actual vacancy rate?
- The area grade is low — what's the realistic commute time and amenity access for the typical tenant pool here? Any planned neighborhood developments (good or bad) we should know about?
- What's the average days-on-market for RENTAL listings here right now (not sales)? A rising rental-DOM trend means longer vacancies and softer asking-rent achievability than the comps imply.
- What's the recent tenant-quality profile in this submarket — average credit score on applications, eviction rate, late-payment / NSF rate, and stable-employment percentage? A property-management company in the area should have these aggregated.
CashFlowRE · CFR-RKPEK3AM53ASSK
· Data 2 days ago
cashflowre.app · 2026-05-29