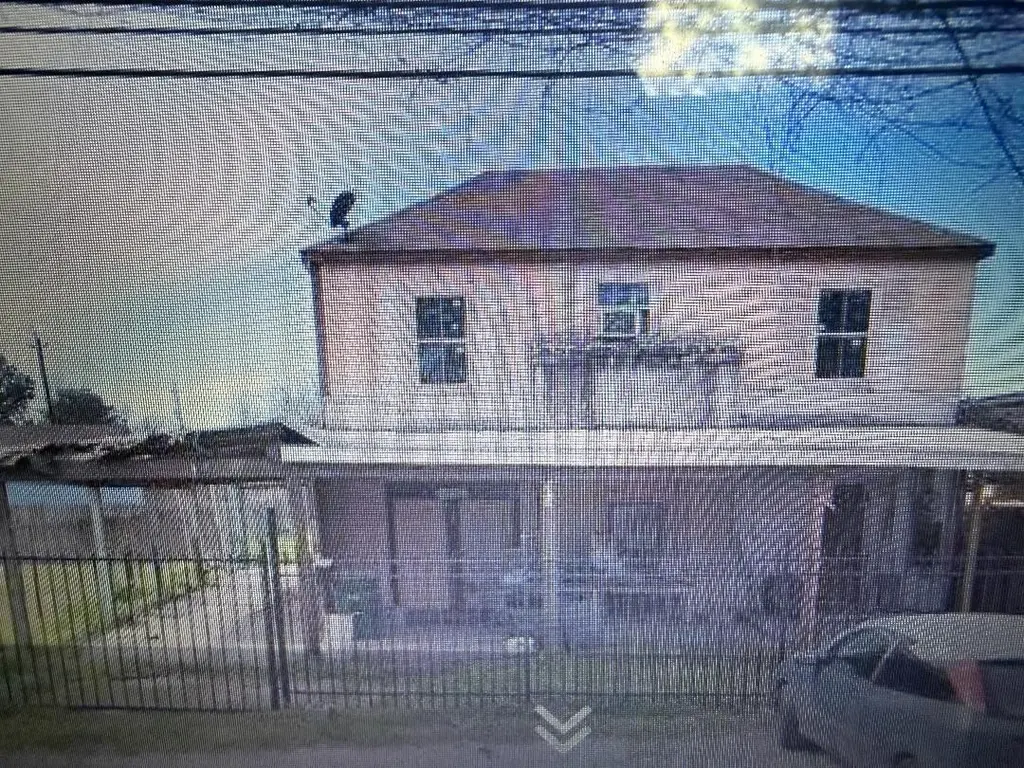
6205 Jensen Dr
Houston, TX 77026
$135,000B+
3 bd · 2.0 ba ·
2,273 sqft ·
Built 1940
· SingleFamily
· Active
· 52 DOM
Cashflow @ list (25.0% down · 7.5%)
Estimated rent
$2,106/mo
Mortgage (P&I)
−$708
Tax + insurance
−$330
HOA
−$0
Vac / Maint / Mgmt
−$442
Net cashflow
$626/mo
Annual
$7,518/yr
Cap rate
11.86%
Cash-on-cash
19.89%
DSCR
1.88
1% rule
1.56%
Cash to close
$37,800
Investor read
- This is a 3-bed/2.0-bath single-family listed at $135k.
- At list price, monthly cash flow is $626 ($8k/yr) — positive.
- The deal already cash-flows at list — no discount required.
- Meets the 1% rule at list price ($2k rent vs $135k).
- It's been on market 52 days — a 3% lower offer ($131k) is reasonable based on typical stale-listing flexibility.
- Recommended offer: $131k (3.0% below list) — sets the bar for market timing.
- In year one you build about $6k of equity ($933 loan paydown + $5k appreciation (3.9% local appreciation)).
- Location reads 74/100 on livability (#184 in TX, #4,771 nationally) — a middle-class / working-renter tenant base. Strengths: amenities A+, cost of living A+, housing A+; Watch: crime F.
- Houston ISD (urban): math 27% / reading 35% proficiency, ranked #593 of 826 in TX (top 72%) — families likely to look elsewhere, expect single-tenant / working-renter base with shorter leases; 71% free/reduced lunch — lower-income household profile, screen leases tightly.
- Zoned schools: Key Middle (math 10% / reading 20%, grade F, #1,569 of 1,662 statewide, top 95%, 615 students, 100% FRL); Northside H S (math 15% / reading 26%, grade F, #1,389 of 1,632 statewide, top 86%, 1,168 students, 94% FRL) — zoned schools average 97% FRL vs 71% district-wide (26 pts higher); higher-poverty schools than district average — tighter screening recommended.
- Zoned-school proficiency averages 18% at this address vs 31% district-wide (-13 pts) — the specific schools serving this property underperform the Houston ISD average; the district grade overstates school quality for this exact location.
- Watch-outs: built in 1940 — expect roof / HVAC / electrical / plumbing capex.
- Market conditions: Rents rising (+3.1%/yr); 445 active listings in the ZIP; 8 comparable units currently listed for rent nearby; rentals lingering (median 44d on market — plan ~5-8 weeks vacancy on turnover, expect pricing pressure); 50% of comp listings sitting > 30 days — soft ceiling on asking rent; lower-income renter base — watch delinquency; 29,883 units permitted in Harris County in 2024 (8,621 in 5+ unit buildings).
- Harris County population projected at +47% by 2050 — long-run rental-demand tailwind backs the buy-and-hold thesis.
- 3 sale attempts since 2y ago; this cycle's ask has dropped $95k (41%) from the opening price — seller is motivated, your offer sets the floor, not the list.
- At projected returns (3.9% appreciation + 3.1% rent growth), your $38k cash investment doubles in ~3 years — after that, you're playing with house money.
- By year 6, paydown + projected appreciation supports a ~$33k cash-out refi (75% LTV) — recoverable capital for the next deal without selling this one.
- Climate carrying-cost: severe wind risk, 99% chance of damaging wind over 30y; extreme-heat days projected 7→24/yr by 2055 (HVAC capex compounding) — expect insurance premiums to compound above CPI over the hold.
Questions for listing agent
- It's been on market 52 days. Have you received any prior offers? Is the seller open to a 3% concession, seller financing, or rate buy-down credit?
- Built in 1940 — when were the roof, HVAC, electrical panel, plumbing, and water heater last replaced?
- Is there a deadline driving the sale (1031 exchange, divorce, estate, relocation)? That informs how much negotiation room exists.
- Schools are D-rated, which usually means shorter tenancies and higher turnover. Who's the typical renter profile here, and what's been the actual vacancy rate?
- Crime grade is F in this area — have there been break-ins, vandalism, or insurance claims at this property in the last 3 years? What carrier currently insures it and at what premium?
- What's the average days-on-market for RENTAL listings here right now (not sales)? A rising rental-DOM trend means longer vacancies and softer asking-rent achievability than the comps imply.
- What's the recent tenant-quality profile in this submarket — average credit score on applications, eviction rate, late-payment / NSF rate, and stable-employment percentage? A property-management company in the area should have these aggregated.
- How much new for-sale + rental construction is in the pipeline within 1–3 miles? Heavy new supply typically softens prices + rents 12–24 months out; constrained supply supports both.
CashFlowRE · CFR-RMEMT78JS2MQG6
· Data 2 days ago
cashflowre.app · 2026-05-29