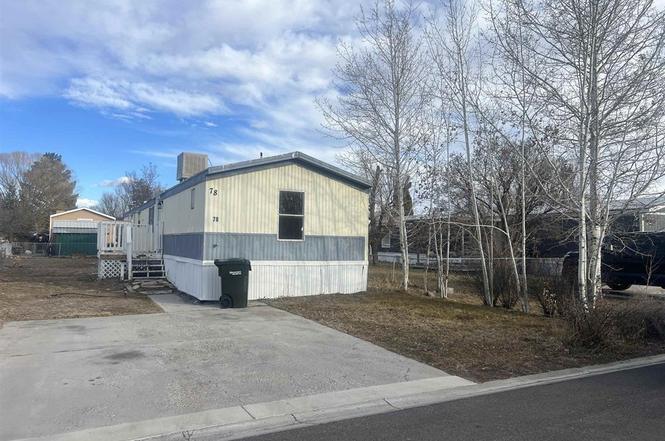
62880 Lasalle Rd Unit 78 (Spruce Drive)
Montrose, CO 81401
$72,000B+
3 bd · 1.0 ba ·
1,216 sqft ·
Built 1994
· Manufactured
· Active
· 116 DOM
Cashflow @ list (25.0% down · 7.5%)
Estimated rent
$1,900/mo
Mortgage (P&I)
−$378
Tax + insurance
−$471
HOA
−$0
Vac / Maint / Mgmt
−$399
Net cashflow
$652/mo
Annual
$7,829/yr
Cap rate
24.28%
Cash-on-cash
64.22%
DSCR
3.86
1% rule
2.64%
Cash to close
$20,160
Investor read
- This is a 3-bed/1.0-bath manufactured listed at $72k.
- At list price, monthly cash flow is $652 ($8k/yr) — positive.
- The deal already cash-flows at list — no discount required.
- Meets the 1% rule at list price ($2k rent vs $72k).
- It's been on market 116 days — a 9% lower offer ($66k) is reasonable based on typical stale-listing flexibility.
- Recommended offer: $66k (9.0% below list) — sets the bar for market timing.
- Local home prices are declining (-3.0%/yr); year-one equity from $498 of loan paydown is wiped out by about $2k of value loss. Plan a longer hold.
- Location reads 68/100 on livability (#109 in CO) — a middle-class / working-renter tenant base. Strengths: housing A+; Watch: amenities C-, schools D+, employment D+.
- Montrose County School District Re-1J (town): math 22% / reading 36% proficiency, ranked #55 of 86 in CO (top 64%) — low school quality limits family demand, transient renter base, plan for 1-2y turnover.
- Watch-outs: flood insurance adds $427/mo.
- Market conditions: 371 active listings in the ZIP; 271 units permitted in Montrose County in 2024 (22 in 5+ unit buildings).
- Montrose County population projected at -25% by 2050 — secular population decline; favor cash flow + early exit over multi-decade hold.
- At projected returns (-3.0% appreciation + 3.0% rent growth), your $20k cash investment doubles in ~4 years — after that, you're playing with house money.
- Climate carrying-cost: in FEMA flood zone AE (mandatory federal flood insurance) — expect insurance premiums to compound above CPI over the hold.
- Cap rate 24.3% vs local median 2.0% in Montrose — top-decile yield for the area; either an underpriced asset or a hidden risk that comps aren't pricing in. Stress-test before assuming the spread holds.
- This rent runs 32% of the median local income ($71k/yr) — at the standard rent-burdened threshold; future hikes will face affordability resistance.
Questions for listing agent
- It's been on market 116 days. Have you received any prior offers? Is the seller open to a 9% concession, seller financing, or rate buy-down credit?
- What's the actual annual flood-insurance premium (NFIP or private), and is the property in a SFHA with mandatory coverage?
- Why hasn't it sold? Are there any deal-killer items the seller is aware of (foundation, flood, title, zoning, code violations)?
- Is there a deadline driving the sale (1031 exchange, divorce, estate, relocation)? That informs how much negotiation room exists.
- Schools are D-rated, which usually means shorter tenancies and higher turnover. Who's the typical renter profile here, and what's been the actual vacancy rate?
- What's the average days-on-market for RENTAL listings here right now (not sales)? A rising rental-DOM trend means longer vacancies and softer asking-rent achievability than the comps imply.
- What's the recent tenant-quality profile in this submarket — average credit score on applications, eviction rate, late-payment / NSF rate, and stable-employment percentage? A property-management company in the area should have these aggregated.
- How much new for-sale + rental construction is in the pipeline within 1–3 miles? Heavy new supply typically softens prices + rents 12–24 months out; constrained supply supports both.
CashFlowRE · CFR-RMGQTXC83N8BYY
· Data 1 day ago
cashflowre.app · 2026-05-29