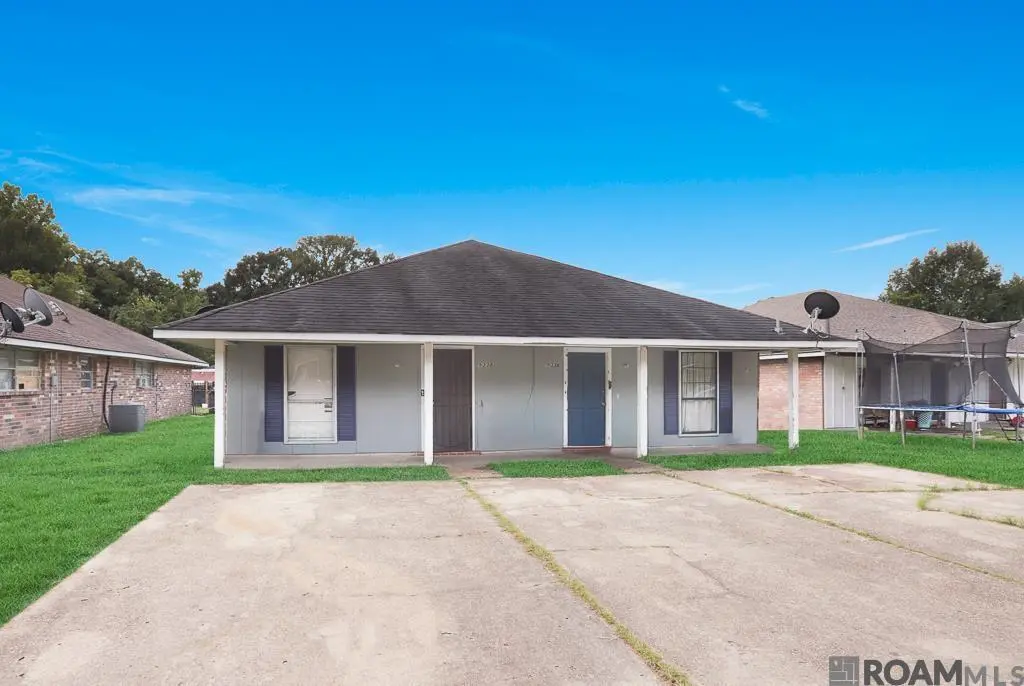
9336 & 9338 Prescott Dr
Merrydale, LA 70814
$144,900C+
None bd · None ba ·
1,988 sqft ·
Built —
· MultiFamily
· Active
· 301 DOM
Cashflow @ list (25.0% down · 7.5%)
Estimated rent
$1,871/mo
Mortgage (P&I)
−$760
Tax + insurance
−$668
HOA
−$0
Vac / Maint / Mgmt
−$393
Net cashflow
$50/mo
Annual
$602/yr
Cap rate
10.24%
Cash-on-cash
14.10%
DSCR
1.63
1% rule
1.29%
Cash to close
$40,572
Investor read
- This is a 2 × 2-bed/1-bath units multifamily listed at $145k. Condition is rated good.
- At list price, monthly cash flow is $50 ($602/yr) — positive. Per door: $25/mo.
- The deal already cash-flows at list — no discount required.
- Meets the 1% rule at list price ($2k rent vs $145k).
- It's been on market 301 days — a 12% lower offer ($128k) is reasonable based on typical stale-listing flexibility.
- Recommended offer: $128k (12.0% below list) — sets the bar for market timing.
- Local home prices are declining (-3.0%/yr); year-one equity from $1k of loan paydown is wiped out by about $4k of value loss. Plan a longer hold.
- Location reads 58/100 on livability (#301 in LA) — a working-class tenant base; expect higher turnover. Strengths: cost of living A+, housing A; Watch: schools C-, crime F, amenities F.
- East Baton Rouge Parish (urban): math 22% / reading 34% proficiency, ranked #47 of 98 in LA (top 48%) — low school quality limits family demand, transient renter base, plan for 1-2y turnover; 77% free/reduced lunch — lower-income household profile, screen leases tightly.
- Watch-outs: flood insurance adds $427/mo.
- Market conditions: 69 active listings in the ZIP; 4 comparable units currently listed for rent nearby; rentals at typical pace (median 24d on market — plan ~3-4 weeks tenant-placement turnaround); 2,252 units permitted in East Baton Rouge Parish in 2024 (440 in 5+ unit buildings).
- East Baton Rouge County population projected at +4% by 2050 — modest demand growth; plan on rents tracking national, not racing it.
- 2 sale attempts with the ask held roughly flat each time — persistent listings suggest the price (not the market) is what's stuck; bring a comps-based counter.
- Climate carrying-cost: in FEMA flood zone AE (mandatory federal flood insurance); severe wind risk, 99% chance of damaging wind over 30y; extreme-heat days projected 7→20/yr by 2055 (HVAC capex compounding) — expect insurance premiums to compound above CPI over the hold.
- Cap rate 10.2% vs local median 7.8% in Merrydale — top-decile yield for the area; either an underpriced asset or a hidden risk that comps aren't pricing in. Stress-test before assuming the spread holds.
Questions for listing agent
- It's been on market 301 days. Have you received any prior offers? Is the seller open to a 12% concession, seller financing, or rate buy-down credit?
- Can we see the unit-by-unit rent roll, current vacancy, and any below-market leases? What's the average tenancy length?
- What capital expenditures (roof, boiler, parking lot, exteriors) have been made in the last 5 years, and what's planned in the next 2?
- What's the actual annual flood-insurance premium (NFIP or private), and is the property in a SFHA with mandatory coverage?
- Why hasn't it sold? Are there any deal-killer items the seller is aware of (foundation, flood, title, zoning, code violations)?
- Is there a deadline driving the sale (1031 exchange, divorce, estate, relocation)? That informs how much negotiation room exists.
- Crime grade is F in this area — have there been break-ins, vandalism, or insurance claims at this property in the last 3 years? What carrier currently insures it and at what premium?
- What's the average days-on-market for RENTAL listings here right now (not sales)? A rising rental-DOM trend means longer vacancies and softer asking-rent achievability than the comps imply.
CashFlowRE · CFR-RN1X9P5GPWFNEB
· Data 2 days ago
cashflowre.app · 2026-05-29