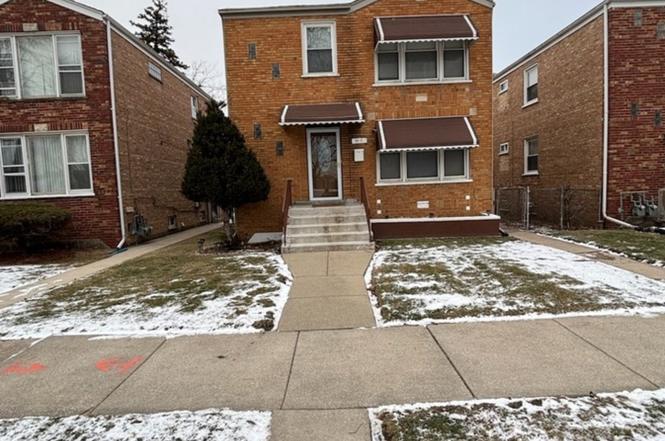
3513 Jackson St
Bellwood, IL 60104
$365,000C-
4 bd · 3.6 ba ·
— sqft ·
Built 1950
· MultiFamily
· Pending
· 41 DOM
Cashflow @ list (25.0% down · 7.5%)
Estimated rent
$3,795/mo
Mortgage (P&I)
−$1,914
Tax + insurance
−$608
HOA
−$0
Vac / Maint / Mgmt
−$797
Net cashflow
$476/mo
Annual
$5,707/yr
Cap rate
7.86%
Cash-on-cash
5.58%
DSCR
1.25
1% rule
1.04%
Cash to close
$102,200
Investor read
- This is a 2 × 2-bed/1.5-bath units multifamily listed at $365k.
- At list price, monthly cash flow is $476 ($6k/yr) — positive. Per door: $238/mo.
- The deal already cash-flows at list — no discount required.
- Meets the 1% rule at list price ($4k rent vs $365k).
- It's been on market 41 days — a 3% lower offer ($354k) is reasonable based on typical stale-listing flexibility.
- Recommended offer: $354k (3.0% below list) — sets the bar for market timing.
- Local home prices are declining (-3.0%/yr); year-one equity from $3k of loan paydown is wiped out by about $11k of value loss. Plan a longer hold.
- Location reads 77/100 on livability (#155 in IL, #2,847 nationally) — a middle-class / working-renter tenant base. Strengths: commute A+, cost of living A+, housing A+; Watch: health & safety D+, amenities F.
- Proviso Twp Hsd 209 (suburban): math 12% / reading 17% proficiency, ranked #507 of 620 in IL (top 82%) — low school quality limits family demand, transient renter base, plan for 1-2y turnover.
- Zoned schools: Proviso East High School (math 4% / reading 6%, grade F, #614 of 693 statewide, top 95%, 1,658 students, 0% FRL).
- Watch-outs: built in 1950 — expect roof / HVAC / electrical / plumbing capex.
- Market conditions: 41 active listings in the ZIP; 7 comparable units currently listed for rent nearby; rentals at typical pace (median 16d on market — plan ~3-4 weeks tenant-placement turnaround); 6,272 units permitted in Cook County in 2024 (4,658 in 5+ unit buildings).
- 3 sale attempts since 11y ago with the ask held roughly flat each time — persistent listings suggest the price (not the market) is what's stuck; bring a comps-based counter.
- Current owner paid $119k; list at $365k implies a 207% gain — meaningful room to come down on a strong offer.
- Cap rate 7.9% vs local median 5.3% in Bellwood — top-decile yield for the area; either an underpriced asset or a hidden risk that comps aren't pricing in. Stress-test before assuming the spread holds.
Questions for listing agent
- It's been on market 41 days. Have you received any prior offers? Is the seller open to a 3% concession, seller financing, or rate buy-down credit?
- Can we see the unit-by-unit rent roll, current vacancy, and any below-market leases? What's the average tenancy length?
- What capital expenditures (roof, boiler, parking lot, exteriors) have been made in the last 5 years, and what's planned in the next 2?
- Built in 1950 — when were the roof, HVAC, electrical panel, plumbing, and water heater last replaced?
- Is there a deadline driving the sale (1031 exchange, divorce, estate, relocation)? That informs how much negotiation room exists.
- Schools are F-rated, which usually means shorter tenancies and higher turnover. Who's the typical renter profile here, and what's been the actual vacancy rate?
- What's the average days-on-market for RENTAL listings here right now (not sales)? A rising rental-DOM trend means longer vacancies and softer asking-rent achievability than the comps imply.
- What's the recent tenant-quality profile in this submarket — average credit score on applications, eviction rate, late-payment / NSF rate, and stable-employment percentage? A property-management company in the area should have these aggregated.
CashFlowRE · CFR-RNCDJNAK4ZYMRF
· Data 3 weeks ago
cashflowre.app · 2026-05-29