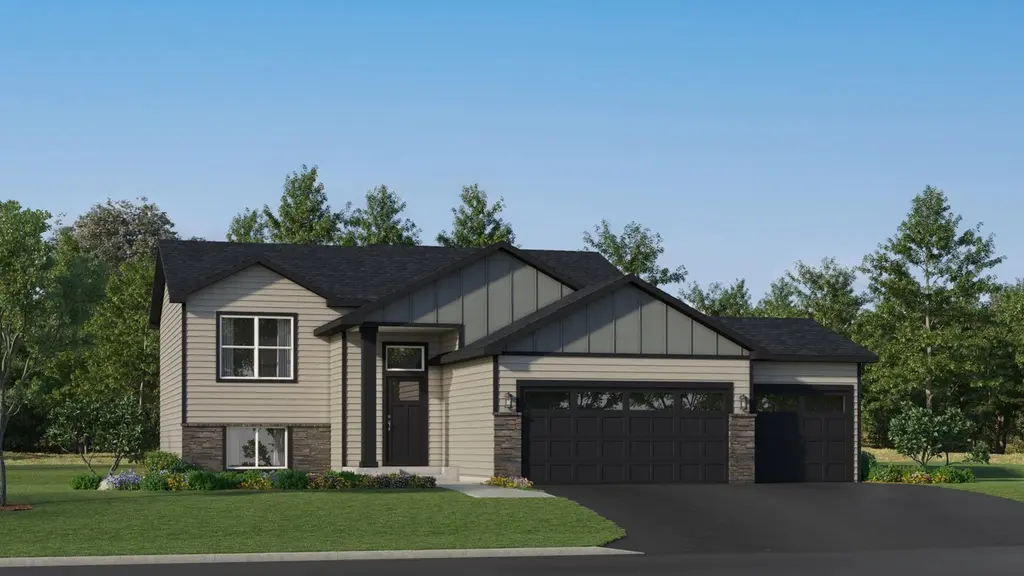
2413 Jandell Ave NE
St. Michael, MN 55341
$439,290D
5 bd · 3.0 ba ·
2,199 sqft ·
Built 2026
· Other
· Pending
· 69 DOM
Cashflow @ list (25.0% down · 7.5%)
Estimated rent
$3,302/mo
Mortgage (P&I)
−$2,304
Tax + insurance
−$732
HOA
−$40
Vac / Maint / Mgmt
−$693
Net cashflow
$-467/mo
Annual
$-5,606/yr
Cap rate
5.02%
Cash-on-cash
-4.56%
DSCR
0.80
1% rule
0.75%
Cash to close
$123,001
Investor read
- This is a 5-bed/3.0-bath other listed at $439k.
- At list price, monthly cash flow is $-467 ($-6k/yr) — negative.
- To cash-flow at today's rent, offer at most $372k (15.4% below list).
- To meet the 1% rule (rent ≥ 1% of price), the offer needs to be $330k (24.8% below list).
- It's been on market 69 days — a 6% lower offer ($413k) is reasonable based on typical stale-listing flexibility.
- Recommended offer: $330k (24.8% below list) — sets the bar for 1% rule.
- Local home prices are declining (-3.0%/yr); year-one equity from $3k of loan paydown is wiped out by about $13k of value loss. Plan a longer hold.
- Location reads: area grade D — affects rentability + tenant quality, not the cash-flow math above.
- St. Michael-Albertville School District (rural): math 62% / reading 66% proficiency, ranked #17 of 301 in MN (top 6%) — acceptable for families but not a draw, mixed tenant base, ~2y average lease; only 9% free/reduced lunch — higher-income household profile.
- Zoned schools: St. Michael Elementary (math 84% / reading 71%, grade A, #21 of 857 statewide, top 3%, 588 students, 23% FRL); St. Michael-Albertville Middle East (math 57% / reading 65%, grade B+, #24 of 258 statewide, top 9%, 892 students, 18% FRL); St. Michael-Albertville Senior High (math 60% / reading 71%, grade B, #27 of 471 statewide, top 6%, 2,240 students, 17% FRL).
- Market conditions: 102 active listings in the ZIP; 1,260 units permitted in Wright County in 2024 (180 in 5+ unit buildings).
- Wright County population projected at +9% by 2050 — modest demand growth; plan on rents tracking national, not racing it.
- 2 sale attempts; this cycle's ask has dropped $34k (7%) from the opening price — seller is motivated, your offer sets the floor, not the list.
- Cap rate 5.0% vs local median 3.2% in St. Michael — top-decile yield for the area; either an underpriced asset or a hidden risk that comps aren't pricing in. Stress-test before assuming the spread holds.
Questions for listing agent
- What do current leases actually rent for vs. the listed asking? Can we see a recent rent roll and the last 12 months of T-12 income?
- It's been on market 69 days. Have you received any prior offers? Is the seller open to a 25% concession, seller financing, or rate buy-down credit?
- What does the HOA fee cover, when was the last increase, and are there any pending special assessments or reserve-fund shortfalls?
- Why hasn't it sold? Are there any deal-killer items the seller is aware of (foundation, flood, title, zoning, code violations)?
- Is there a deadline driving the sale (1031 exchange, divorce, estate, relocation)? That informs how much negotiation room exists.
- The area grade is low — what's the realistic commute time and amenity access for the typical tenant pool here? Any planned neighborhood developments (good or bad) we should know about?
- What's the average days-on-market for RENTAL listings here right now (not sales)? A rising rental-DOM trend means longer vacancies and softer asking-rent achievability than the comps imply.
- What's the recent tenant-quality profile in this submarket — average credit score on applications, eviction rate, late-payment / NSF rate, and stable-employment percentage? A property-management company in the area should have these aggregated.
CashFlowRE · CFR-RNK8D63XE6X10X
· Data 1 week ago
cashflowre.app · 2026-05-29