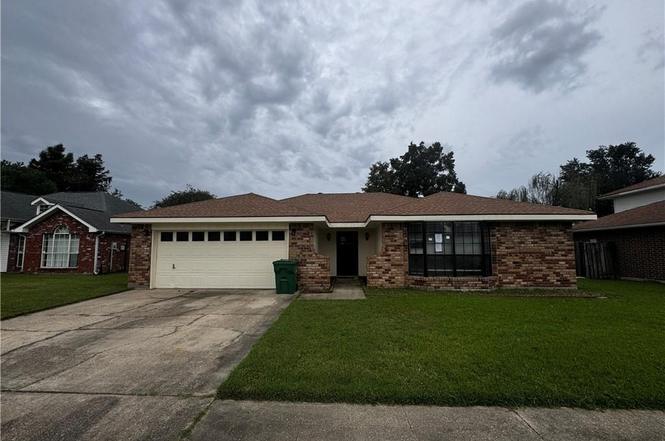
2117 Colonial Dr
Laplace, LA 70068
$186,760D+
3 bd · 2.0 ba ·
1,479 sqft ·
Built 1982
· SingleFamily
· Pending
· 72 DOM
Cashflow @ list (25.0% down · 7.5%)
Estimated rent
$1,752/mo
Mortgage (P&I)
−$979
Tax + insurance
−$367
HOA
−$0
Vac / Maint / Mgmt
−$368
Net cashflow
$38/mo
Annual
$453/yr
Cap rate
6.96%
Cash-on-cash
2.39%
DSCR
1.11
1% rule
0.94%
Cash to close
$52,293
Investor read
- This is a 3-bed/2.0-bath single-family listed at $187k.
- At list price, monthly cash flow is $38 ($453/yr) — positive.
- The deal already cash-flows at list — no discount required.
- To meet the 1% rule (rent ≥ 1% of price), the offer needs to be $175k (6.2% below list).
- It's been on market 72 days — a 6% lower offer ($176k) is reasonable based on typical stale-listing flexibility.
- Recommended offer: $175k (6.2% below list) — sets the bar for 1% rule.
- Local home prices are declining (-3.0%/yr); year-one equity from $1k of loan paydown is wiped out by about $6k of value loss. Plan a longer hold.
- Location reads 70/100 on livability (#61 in LA) — a middle-class / working-renter tenant base. Strengths: cost of living A+, housing A+, health & safety A+; Watch: crime F, amenities F, commute F.
- St. John The Baptist Parish (suburban): math 13% / reading 25% proficiency, ranked #68 of 98 in LA (top 69%) — low school quality limits family demand, transient renter base, plan for 1-2y turnover; 82% free/reduced lunch — lower-income household profile, screen leases tightly.
- Watch-outs: flood insurance adds $66/mo.
- Market conditions: 180 active listings in the ZIP; 1 comparable units currently listed for rent nearby; 61 units permitted in St. John the Baptist Parish in 2024 (0 in 5+ unit buildings).
- St. John the Baptist County population projected at -20% by 2050 — secular population decline; favor cash flow + early exit over multi-decade hold.
- 8 sale attempts since 29y ago; this cycle's ask has dropped $16k (8%) from the opening price — seller is motivated, your offer sets the floor, not the list.
- Climate carrying-cost: severe flood risk; severe wind risk, 99% chance of damaging wind over 30y; extreme-heat days projected 7→22/yr by 2055 (HVAC capex compounding) — expect insurance premiums to compound above CPI over the hold.
- Cap rate 7.0% vs local median 4.8% in Laplace — top-decile yield for the area; either an underpriced asset or a hidden risk that comps aren't pricing in. Stress-test before assuming the spread holds.
- This rent runs 31% of the median local income ($68k/yr) — at the standard rent-burdened threshold; future hikes will face affordability resistance.
Questions for listing agent
- It's been on market 72 days. Have you received any prior offers? Is the seller open to a 6% concession, seller financing, or rate buy-down credit?
- What's the actual annual flood-insurance premium (NFIP or private), and is the property in a SFHA with mandatory coverage?
- Why hasn't it sold? Are there any deal-killer items the seller is aware of (foundation, flood, title, zoning, code violations)?
- Is there a deadline driving the sale (1031 exchange, divorce, estate, relocation)? That informs how much negotiation room exists.
- Crime grade is F in this area — have there been break-ins, vandalism, or insurance claims at this property in the last 3 years? What carrier currently insures it and at what premium?
- The area grade is low — what's the realistic commute time and amenity access for the typical tenant pool here? Any planned neighborhood developments (good or bad) we should know about?
- What's the average days-on-market for RENTAL listings here right now (not sales)? A rising rental-DOM trend means longer vacancies and softer asking-rent achievability than the comps imply.
- What's the recent tenant-quality profile in this submarket — average credit score on applications, eviction rate, late-payment / NSF rate, and stable-employment percentage? A property-management company in the area should have these aggregated.
CashFlowRE · CFR-RPSEFCAK8JFDE3
· Data 3 weeks ago
cashflowre.app · 2026-05-29