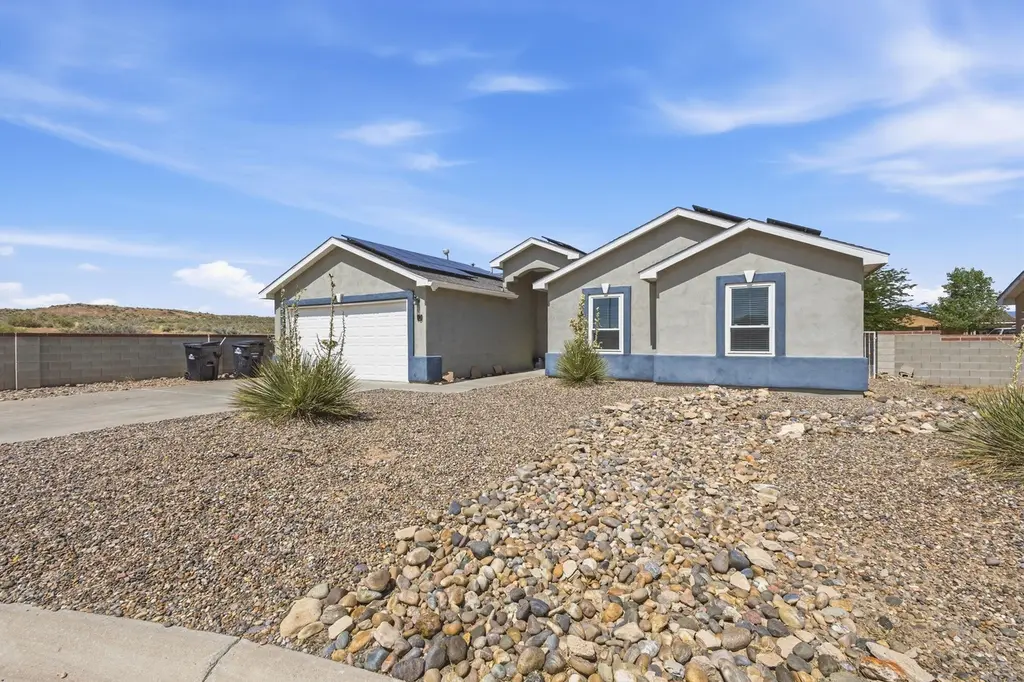
10 Psalms Pl
Las Maravillas, NM 87031
$279,900D-
3 bd · 2.0 ba ·
1,475 sqft ·
Built 2005
· SingleFamily
· Active
· 26 DOM
Cashflow @ list (25.0% down · 7.5%)
Estimated rent
$2,123/mo
Mortgage (P&I)
−$1,468
Tax + insurance
−$200
HOA
−$0
Vac / Maint / Mgmt
−$446
Net cashflow
$9/mo
Annual
$106/yr
Cap rate
6.33%
Cash-on-cash
0.14%
DSCR
1.01
1% rule
0.76%
Cash to close
$78,372
Investor read
- This is a 3-bed/2.0-bath single-family listed at $280k.
- At list price, monthly cash flow is $9 ($106/yr) — positive.
- The deal already cash-flows at list — no discount required.
- To meet the 1% rule (rent ≥ 1% of price), the offer needs to be $212k (24.2% below list).
- It's been on market 26 days — a 2% lower offer ($276k) is reasonable based on typical stale-listing flexibility.
- Recommended offer: $212k (24.2% below list) — sets the bar for 1% rule.
- Local home prices are declining (-3.0%/yr); year-one equity from $2k of loan paydown is wiped out by about $8k of value loss. Plan a longer hold.
- Location reads 58/100 on livability (#152 in NM) — a working-class tenant base; expect higher turnover. Strengths: cost of living A+, housing A+; Watch: employment C-, amenities F, commute F.
- Los Lunas Public Schools (suburban): math 20% / reading 34% proficiency, ranked #34 of 95 in NM (top 36%) — low school quality limits family demand, transient renter base, plan for 1-2y turnover; 63% free/reduced lunch — lower-income household profile, screen leases tightly.
- Zoned schools: La Merced Elementary (437 students, 100% FRL); Belen Middle (528 students, 100% FRL); Belen High (math 30% / reading 50%, grade F, #61 of 110 statewide, top 61%, 1,027 students, 100% FRL) — zoned schools average 100% FRL vs 63% district-wide (37 pts higher); higher-poverty schools than district average — tighter screening recommended.
- Zoned-school proficiency averages 40% at this address vs 27% district-wide (+13 pts) — the actual schools serving this property are materially stronger than the Los Lunas Public Schools average implies; a family-tenant draw the district grade alone would hide.
- Market conditions: Rents rising fast (+33.2%/yr); 567 active listings in the ZIP; 1 comparable units currently listed for rent nearby; 303 units permitted in Valencia County in 2024 (0 in 5+ unit buildings).
- Valencia County population projected at -14% by 2050 — secular population decline; favor cash flow + early exit over multi-decade hold.
- 2 sale attempts since 11y ago with the ask held roughly flat each time — persistent listings suggest the price (not the market) is what's stuck; bring a comps-based counter.
- Climate carrying-cost: moderate wildfire risk; extreme-heat days projected 7→20/yr by 2055 (HVAC capex compounding) — expect insurance premiums to compound above CPI over the hold.
- This rent runs 42% of the median local income ($61k/yr) — at the standard rent-burdened threshold; future hikes will face affordability resistance.
Questions for listing agent
- Is there a deadline driving the sale (1031 exchange, divorce, estate, relocation)? That informs how much negotiation room exists.
- Schools are F-rated, which usually means shorter tenancies and higher turnover. Who's the typical renter profile here, and what's been the actual vacancy rate?
- The area grade is low — what's the realistic commute time and amenity access for the typical tenant pool here? Any planned neighborhood developments (good or bad) we should know about?
- What's the average days-on-market for RENTAL listings here right now (not sales)? A rising rental-DOM trend means longer vacancies and softer asking-rent achievability than the comps imply.
- What's the recent tenant-quality profile in this submarket — average credit score on applications, eviction rate, late-payment / NSF rate, and stable-employment percentage? A property-management company in the area should have these aggregated.
- How much new for-sale + rental construction is in the pipeline within 1–3 miles? Heavy new supply typically softens prices + rents 12–24 months out; constrained supply supports both.
CashFlowRE · CFR-RQ8EA91BMKCAMW
· Data 13 h ago
cashflowre.app · 2026-05-29