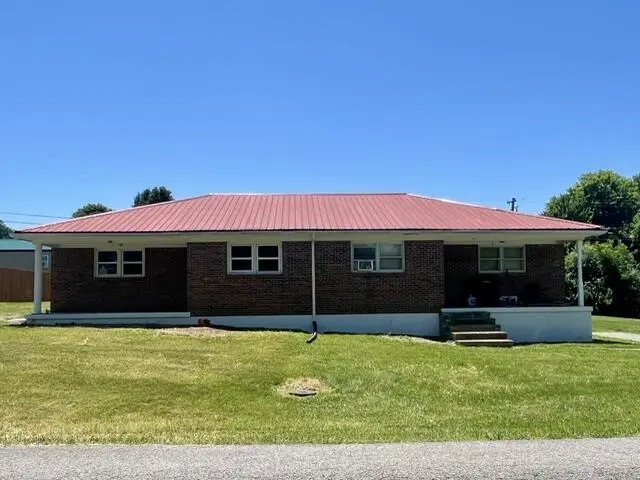
114-116 E Mason Ave
Danville, KY 40422
$197,400C
4 bd · 2.0 ba ·
1,782 sqft ·
Built 1960
· MultiFamily
· Active
· 15 DOM
Cashflow @ list (25.0% down · 7.5%)
Estimated rent
$2,267/mo
Mortgage (P&I)
−$1,035
Tax + insurance
−$329
HOA
−$0
Vac / Maint / Mgmt
−$476
Net cashflow
$427/mo
Annual
$5,121/yr
Cap rate
8.89%
Cash-on-cash
9.26%
DSCR
1.41
1% rule
1.15%
Cash to close
$55,272
Investor read
- This is a 2 × 2-bed/1.0-bath units multifamily listed at $197k. Condition is rated good.
- At list price, monthly cash flow is $427 ($5k/yr) — positive. Per door: $213/mo.
- The deal already cash-flows at list — no discount required.
- Meets the 1% rule at list price ($2k rent vs $197k).
- It's been on market 15 days — a 2% lower offer ($194k) is reasonable based on typical stale-listing flexibility.
- Recommended offer: $194k (1.5% below list) — sets the bar for market timing.
- Local home prices are declining (-3.0%/yr); year-one equity from $1k of loan paydown is wiped out by about $6k of value loss. Plan a longer hold.
- Location reads 77/100 on livability (#85 in KY, #3,148 nationally) — a middle-class / working-renter tenant base. Strengths: crime A+, cost of living A+, health & safety A+; Watch: amenities F, commute F, employment F.
- Danville Independent (town): math 26% / reading 35% proficiency, ranked #110 of 165 in KY (top 67%) — families likely to look elsewhere, expect single-tenant / working-renter base with shorter leases.
- Zoned schools: Mary G. Hogsett Primary School (367 students, 81% FRL); John W. Bate Middle School (math 19% / reading 37%, grade F, #165 of 217 statewide, top 77%, 399 students, 66% FRL); Danville High School (math 32% / reading 32%, grade F, #97 of 254 statewide, top 46%, 481 students, 63% FRL).
- Market conditions: 165 active listings in the ZIP; 85 units permitted in Boyle County in 2024 (0 in 5+ unit buildings).
- Boyle County population projected at +13% by 2050 — modest demand growth; plan on rents tracking national, not racing it.
- Cap rate 8.9% vs local median 3.0% in Danville — top-decile yield for the area; either an underpriced asset or a hidden risk that comps aren't pricing in. Stress-test before assuming the spread holds.
- At $2,267/mo this rent would consume 46% of the median local household income ($60k/yr) (locally 1047% of renters already pay >50% of income on rent) — very limited rent-growth headroom before tenants either downsize or default.
Questions for listing agent
- Can we see the unit-by-unit rent roll, current vacancy, and any below-market leases? What's the average tenancy length?
- What capital expenditures (roof, boiler, parking lot, exteriors) have been made in the last 5 years, and what's planned in the next 2?
- Built in 1960 — when were the roof, HVAC, electrical panel, plumbing, and water heater last replaced?
- Is there a deadline driving the sale (1031 exchange, divorce, estate, relocation)? That informs how much negotiation room exists.
- What's the average days-on-market for RENTAL listings here right now (not sales)? A rising rental-DOM trend means longer vacancies and softer asking-rent achievability than the comps imply.
- What's the recent tenant-quality profile in this submarket — average credit score on applications, eviction rate, late-payment / NSF rate, and stable-employment percentage? A property-management company in the area should have these aggregated.
- How much new apartment / multifamily construction is in the pipeline within 1–3 miles? Heavy new supply (>2% of stock underway) typically softens rents 12–24 months out; light construction supports rent growth.
CashFlowRE · CFR-RQCAXK84P5DBFB
· Data 2 days ago
cashflowre.app · 2026-05-29