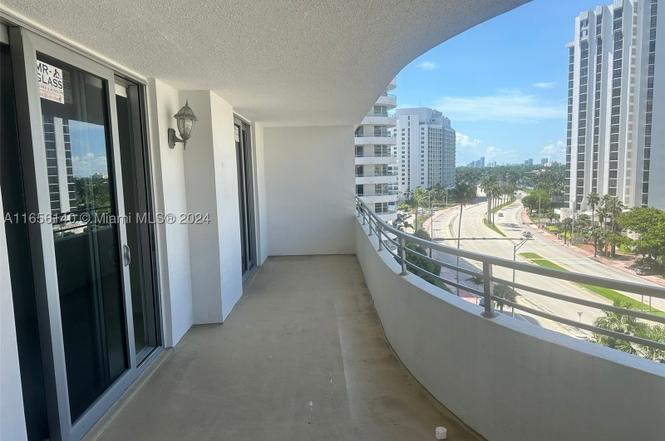
5555 Collins Ave Unit 8Z
Miami Beach, FL 33140
$415,000D-
1 bd · 2.0 ba ·
1,064 sqft ·
Built 1967
· Condo
· Active
· 646 DOM
Cashflow @ list (25.0% down · 7.5%)
Estimated rent
$4,396/mo
Mortgage (P&I)
−$2,176
Tax + insurance
−$1,186
HOA
−$1,573
Vac / Maint / Mgmt
−$923
Net cashflow
$-1,463/mo
Annual
$-17,553/yr
Cap rate
3.30%
Cash-on-cash
-10.70%
DSCR
0.52
1% rule
1.06%
Cash to close
$116,200
Investor read
- This is a 1-bed/2.0-bath condo listed at $415k.
- At list price, monthly cash flow is $-1k ($-18k/yr) — negative.
- The deal already cash-flows at list — no discount required.
- Meets the 1% rule at list price ($4k rent vs $415k).
- It's been on market 646 days — a 12% lower offer ($365k) is reasonable based on typical stale-listing flexibility.
- Recommended offer: $365k (12.0% below list) — sets the bar for market timing.
- In year one you build about $7k of equity ($3k loan paydown + $4k appreciation (1.0% local appreciation)).
- Location reads 80/100 on livability (#108 in FL, #1,672 nationally) — a professional / high-income tenant draw. Strengths: crime A+, commute A+, health & safety A+; Watch: housing C-, amenities D-, cost of living F.
- Watch-outs: flood insurance adds $427/mo; HOA is 36% of rent.
- Market conditions: Rents rising (+3.5%/yr); 670 active listings in the ZIP; 1 comparable units currently listed for rent nearby; solid renter incomes; 10,051 units permitted in Miami-Dade County in 2024 (7,758 in 5+ unit buildings).
- Miami-Dade County population projected at +28% by 2050 — long-run rental-demand tailwind backs the buy-and-hold thesis.
- 5 sale attempts since 5y ago; this cycle's ask is 13075% above the opening price — seller raised mid-cycle; expect resistance to lowballs.
- Current owner paid $315k; 32% above their basis — modest negotiation headroom, anchor on the comps not their cost.
- By year 5, paydown + projected appreciation supports a ~$32k cash-out refi (75% LTV) — recoverable capital for the next deal without selling this one.
- Climate carrying-cost: in FEMA flood zone AE (mandatory federal flood insurance); severe wind risk, 99% chance of damaging wind over 30y; extreme-heat days projected 7→27/yr by 2055 (HVAC capex compounding) — expect insurance premiums to compound above CPI over the hold.
- Cap rate 3.3% vs local median 1.5% in Miami Beach — top-decile yield for the area; either an underpriced asset or a hidden risk that comps aren't pricing in. Stress-test before assuming the spread holds.
- At $4,396/mo this rent would consume 49% of the median local household income ($107k/yr) (locally 870% of renters already pay >50% of income on rent) — very limited rent-growth headroom before tenants either downsize or default.
Questions for listing agent
- What do current leases actually rent for vs. the listed asking? Can we see a recent rent roll and the last 12 months of T-12 income?
- It's been on market 646 days. Have you received any prior offers? Is the seller open to a 12% concession, seller financing, or rate buy-down credit?
- Built in 1967 — when were the roof, HVAC, electrical panel, plumbing, and water heater last replaced?
- What's the actual annual flood-insurance premium (NFIP or private), and is the property in a SFHA with mandatory coverage?
- What does the HOA fee cover, when was the last increase, and are there any pending special assessments or reserve-fund shortfalls?
- Any open or pending special assessments — roof, HVAC, plumbing, elevator, façade? What's the per-unit balance and payoff schedule, and is the seller paying it off at close or rolling it to the buyer?
- Why hasn't it sold? Are there any deal-killer items the seller is aware of (foundation, flood, title, zoning, code violations)?
- Is there a deadline driving the sale (1031 exchange, divorce, estate, relocation)? That informs how much negotiation room exists.
CashFlowRE · CFR-RQQ1PQ8TN9YJ8H
· Data 2 days ago
cashflowre.app · 2026-05-29