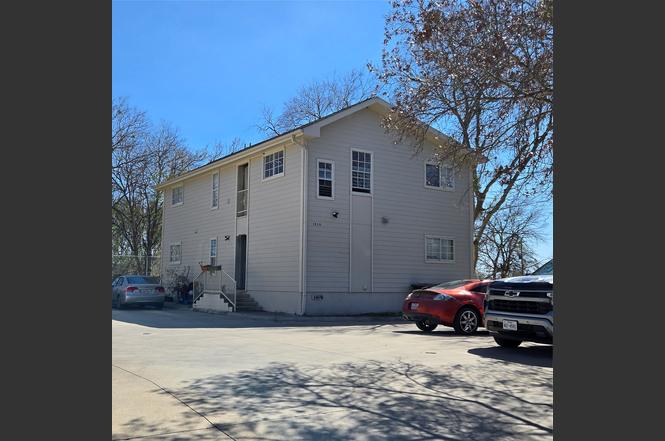
1414-1420 River Rd
San Marcos, TX 78666
$689,900D-
12 bd · 12.0 ba ·
2,320 sqft ·
Built 2002
· MultiFamily
· Active
· 81 DOM
Cashflow @ list (25.0% down · 7.5%)
Estimated rent
$5,638/mo
Mortgage (P&I)
−$3,618
Tax + insurance
−$855
HOA
−$0
Vac / Maint / Mgmt
−$1,184
Net cashflow
$-19/mo
Annual
$-222/yr
Cap rate
6.26%
Cash-on-cash
-0.11%
DSCR
0.99
1% rule
0.82%
Cash to close
$193,172
Investor read
- This is a 4 × 3-bed/3.0-bath units multifamily listed at $690k.
- At list price, monthly cash flow is $-19 ($-222/yr) — negative. Per door: $-5/mo.
- To cash-flow at today's rent, offer at most $687k (0.5% below list).
- To meet the 1% rule (rent ≥ 1% of price), the offer needs to be $564k (18.3% below list).
- It's been on market 81 days — a 6% lower offer ($649k) is reasonable based on typical stale-listing flexibility.
- Recommended offer: $564k (18.3% below list) — sets the bar for 1% rule.
- Local home prices are declining (-3.0%/yr); year-one equity from $5k of loan paydown is wiped out by about $21k of value loss. Plan a longer hold.
- Location reads 81/100 on livability (#30 in TX, #1,601 nationally) — a professional / high-income tenant draw. Strengths: amenities A+, cost of living A+, health & safety A+; Watch: crime D+, schools F, employment F.
- San Marcos CISD (rural): math 18% / reading 31% proficiency, ranked #731 of 826 in TX (top 88%) — low school quality limits family demand, transient renter base, plan for 1-2y turnover; 63% free/reduced lunch — lower-income household profile, screen leases tightly.
- Market conditions: Rents rising (+2.0%/yr); 1122 active listings in the ZIP; 5,270 units permitted in Hays County in 2024 (1,464 in 5+ unit buildings).
- Hays County population projected at +93% by 2050 — long-run rental-demand tailwind backs the buy-and-hold thesis.
- 3 sale attempts since 12y ago with the ask held roughly flat each time — persistent listings suggest the price (not the market) is what's stuck; bring a comps-based counter.
- Cap rate 6.3% vs local median 3.1% in San Marcos — top-decile yield for the area; either an underpriced asset or a hidden risk that comps aren't pricing in. Stress-test before assuming the spread holds.
- At $5,638/mo this rent would consume 124% of the median local household income ($55k/yr) (locally 6504% of renters already pay >50% of income on rent) — very limited rent-growth headroom before tenants either downsize or default.
Questions for listing agent
- What do current leases actually rent for vs. the listed asking? Can we see a recent rent roll and the last 12 months of T-12 income?
- It's been on market 81 days. Have you received any prior offers? Is the seller open to a 18% concession, seller financing, or rate buy-down credit?
- Can we see the unit-by-unit rent roll, current vacancy, and any below-market leases? What's the average tenancy length?
- What capital expenditures (roof, boiler, parking lot, exteriors) have been made in the last 5 years, and what's planned in the next 2?
- Why hasn't it sold? Are there any deal-killer items the seller is aware of (foundation, flood, title, zoning, code violations)?
- Is there a deadline driving the sale (1031 exchange, divorce, estate, relocation)? That informs how much negotiation room exists.
- Schools are F-rated, which usually means shorter tenancies and higher turnover. Who's the typical renter profile here, and what's been the actual vacancy rate?
- Crime grade is D in this area — have there been break-ins, vandalism, or insurance claims at this property in the last 3 years? What carrier currently insures it and at what premium?
CashFlowRE · CFR-RR9AFM5M1Z22CM
· Data 2 days ago
cashflowre.app · 2026-05-29