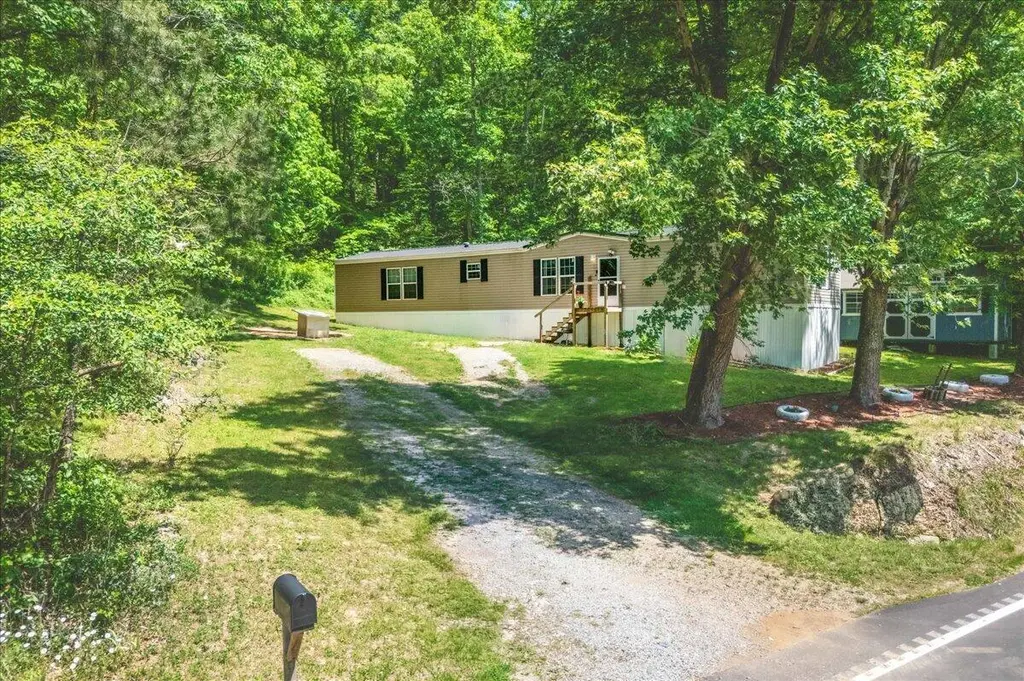
1380 State Highway 472
Manchester, KY 40962
$109,900C-
3 bd · 2.0 ba ·
910 sqft ·
Built 2016
· Other
· Active
· 13 DOM
Cashflow @ list (25.0% down · 7.5%)
Estimated rent
$947/mo
Mortgage (P&I)
−$576
Tax + insurance
−$95
HOA
−$0
Vac / Maint / Mgmt
−$199
Net cashflow
$77/mo
Annual
$930/yr
Cap rate
7.14%
Cash-on-cash
3.02%
DSCR
1.13
1% rule
0.86%
Cash to close
$30,772
Investor read
- This is a 3-bed/2.0-bath other listed at $110k.
- At list price, monthly cash flow is $77 ($930/yr) — positive.
- The deal already cash-flows at list — no discount required.
- To meet the 1% rule (rent ≥ 1% of price), the offer needs to be $95k (13.8% below list).
- Only 13 days on market — expect competitive offers; lowballing is unlikely to land.
- Recommended offer: $95k (13.8% below list) — sets the bar for 1% rule.
- In year one you build about $12k of equity ($760 loan paydown + $11k appreciation (10.0% local appreciation)).
- Location reads 64/100 on livability (#299 in KY) — a middle-class / working-renter tenant base. Strengths: cost of living A+, crime A-, health & safety A-; Watch: amenities F, commute F, employment F.
- Clay County (rural): math 21% / reading 37% proficiency, ranked #130 of 165 in KY (top 79%) — low school quality limits family demand, transient renter base, plan for 1-2y turnover; 66% free/reduced lunch — lower-income household profile, screen leases tightly.
- Zoned schools: Burning Springs Elementary (math 17% / reading 37%, grade F, #434 of 676 statewide, top 69%, 303 students, 79% FRL); Clay County Middle School (math 21% / reading 38%, grade F, #151 of 217 statewide, top 71%, 407 students, 74% FRL); Clay County High School (math 17% / reading 27%, grade F, #202 of 254 statewide, top 82%, 717 students, 70% FRL).
- Market conditions: 84 active listings in the ZIP.
- Clay County population projected at -21% by 2050 — secular population decline; favor cash flow + early exit over multi-decade hold.
- Current owner paid $6k; list at $110k implies a 1732% gain — meaningful room to come down on a strong offer.
- At projected returns (10.0% appreciation + 3.0% rent growth), your $31k cash investment doubles in ~3 years — after that, you're playing with house money.
- By year 4, paydown + projected appreciation supports a ~$42k cash-out refi (75% LTV) — recoverable capital for the next deal without selling this one.
- Cap rate 7.1% vs local median 2.6% in Manchester — top-decile yield for the area; either an underpriced asset or a hidden risk that comps aren't pricing in. Stress-test before assuming the spread holds.
Questions for listing agent
- Is there a deadline driving the sale (1031 exchange, divorce, estate, relocation)? That informs how much negotiation room exists.
- Schools are D-rated, which usually means shorter tenancies and higher turnover. Who's the typical renter profile here, and what's been the actual vacancy rate?
- What's the average days-on-market for RENTAL listings here right now (not sales)? A rising rental-DOM trend means longer vacancies and softer asking-rent achievability than the comps imply.
- What's the recent tenant-quality profile in this submarket — average credit score on applications, eviction rate, late-payment / NSF rate, and stable-employment percentage? A property-management company in the area should have these aggregated.
- How much new for-sale + rental construction is in the pipeline within 1–3 miles? Heavy new supply typically softens prices + rents 12–24 months out; constrained supply supports both.
CashFlowRE · CFR-RTFNJ7DKEPJAQK
· Data 2 days ago
cashflowre.app · 2026-05-29