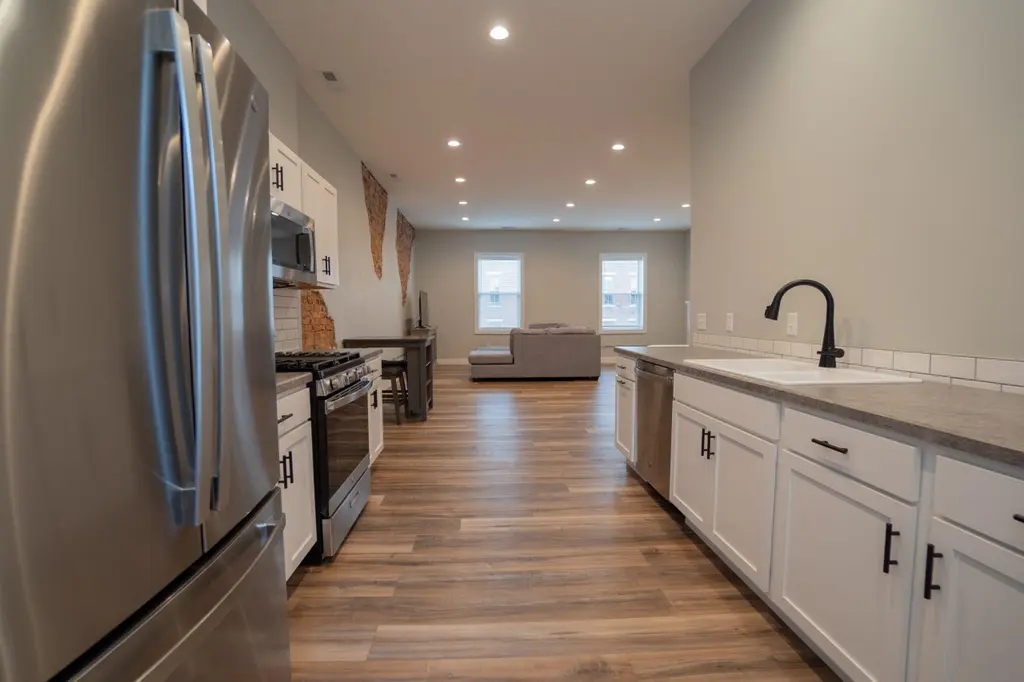
107 N Ohio Ave Unit C
Sidney, OH 45365
$1,100D+
1 bd · 1.0 ba ·
781 sqft ·
Built 1900
· SingleFamily
· Active
· 322 DOM
Cashflow @ list (25.0% down · 7.5%)
Estimated rent
$1,087/mo
Mortgage (P&I)
−$6
Tax + insurance
−$2
HOA
−$0
Vac / Maint / Mgmt
−$228
Net cashflow
$851/mo
Annual
$10,217/yr
Cap rate
935.15%
Cash-on-cash
3317.35%
DSCR
148.60
1% rule
98.86%
Cash to close
$308
Investor read
- This is a 1-bed/1.0-bath single-family listed at $1k.
- At list price, monthly cash flow is $851 ($10k/yr) — positive.
- The deal already cash-flows at list — no discount required.
- Meets the 1% rule at list price ($1k rent vs $1k).
- It's been on market 322 days — a 12% lower offer ($968) is reasonable based on typical stale-listing flexibility.
- Recommended offer: $968 (12.0% below list) — sets the bar for market timing.
- Local home prices are declining (-3.0%/yr); year-one equity from $8 of loan paydown is wiped out by about $33 of value loss. Plan a longer hold.
- Location reads 76/100 on livability (#220 in OH, #3,412 nationally) — a middle-class / working-renter tenant base. Strengths: cost of living A+, housing A+, health & safety A+; Watch: crime C-, employment C-, amenities D.
- Sidney City (town): math 46% / reading 52% proficiency, ranked #454 of 656 in OH (top 69%) — families likely to look elsewhere, expect single-tenant / working-renter base with shorter leases.
- Watch-outs: built in 1900 — expect roof / HVAC / electrical / plumbing capex.
- Market conditions: 145 active listings in the ZIP; 10 comparable units currently listed for rent nearby; rentals leasing fast (median 3d on market — plan ~1-2 weeks tenant-placement turnaround); 337 units permitted in Shelby County in 2024 (216 in 5+ unit buildings).
- Shelby County population projected at -18% by 2050 — secular population decline; favor cash flow + early exit over multi-decade hold.
- At projected returns (-3.0% appreciation + 3.0% rent growth), your $308 cash investment doubles in ~1 year — after that, you're playing with house money.
- Cap rate 935.1% vs local median 4.1% in Sidney — top-decile yield for the area; either an underpriced asset or a hidden risk that comps aren't pricing in. Stress-test before assuming the spread holds.
Questions for listing agent
- It's been on market 322 days. Have you received any prior offers? Is the seller open to a 12% concession, seller financing, or rate buy-down credit?
- Built in 1900 — when were the roof, HVAC, electrical panel, plumbing, and water heater last replaced?
- Why hasn't it sold? Are there any deal-killer items the seller is aware of (foundation, flood, title, zoning, code violations)?
- Is there a deadline driving the sale (1031 exchange, divorce, estate, relocation)? That informs how much negotiation room exists.
- The area grade is low — what's the realistic commute time and amenity access for the typical tenant pool here? Any planned neighborhood developments (good or bad) we should know about?
- What's the average days-on-market for RENTAL listings here right now (not sales)? A rising rental-DOM trend means longer vacancies and softer asking-rent achievability than the comps imply.
- What's the recent tenant-quality profile in this submarket — average credit score on applications, eviction rate, late-payment / NSF rate, and stable-employment percentage? A property-management company in the area should have these aggregated.
- How much new for-sale + rental construction is in the pipeline within 1–3 miles? Heavy new supply typically softens prices + rents 12–24 months out; constrained supply supports both.
CashFlowRE · CFR-RW6MQ44R2436ST
· Data 2 days ago
cashflowre.app · 2026-05-29