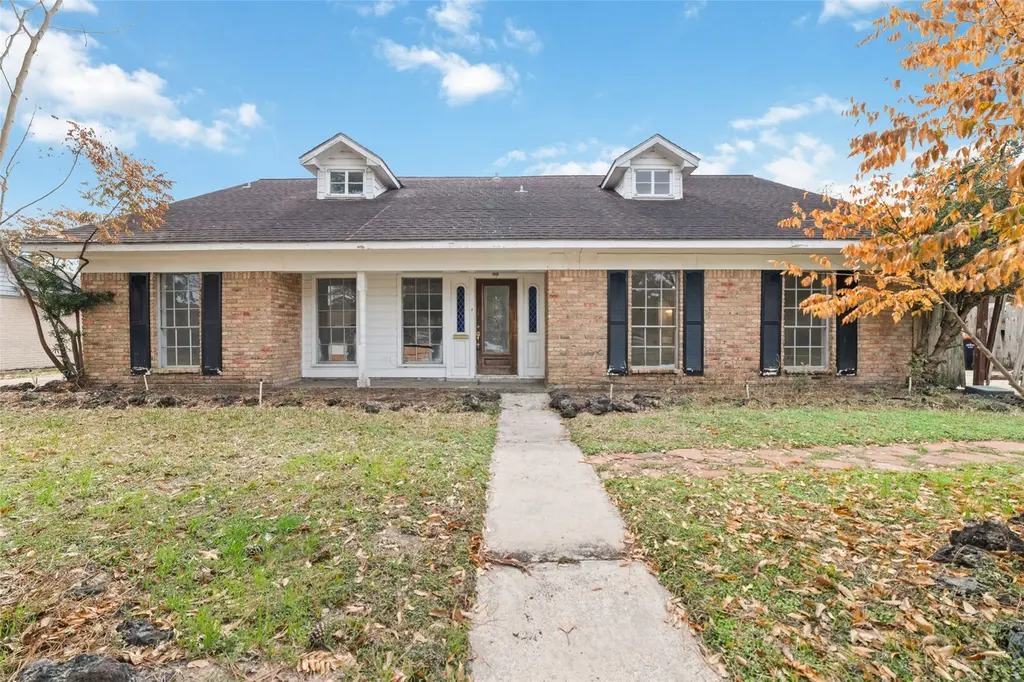
7919 Twin Hills Dr
Houston, TX 77071
$239,990C-
4 bd · 2.5 ba ·
3,019 sqft ·
Built 1962
· SingleFamily
· Pending
· 122 DOM
Cashflow @ list (25.0% down · 7.5%)
Estimated rent
$2,622/mo
Mortgage (P&I)
−$1,259
Tax + insurance
−$818
HOA
−$46
Vac / Maint / Mgmt
−$551
Net cashflow
$-52/mo
Annual
$-619/yr
Cap rate
6.04%
Cash-on-cash
-0.92%
DSCR
0.96
1% rule
1.09%
Cash to close
$67,197
Investor read
- This is a 4-bed/2.5-bath single-family listed at $240k.
- At list price, monthly cash flow is $-52 ($-619/yr) — negative.
- To cash-flow at today's rent, offer at most $231k (3.8% below list).
- Meets the 1% rule at list price ($3k rent vs $240k).
- It's been on market 122 days — a 12% lower offer ($211k) is reasonable based on typical stale-listing flexibility.
- Recommended offer: $211k (12.0% below list) — sets the bar for market timing.
- Local home prices are declining (-0.7%/yr); year-one equity from $2k of loan paydown is wiped out by about $2k of value loss. Plan a longer hold.
- Location reads 74/100 on livability (#184 in TX, #4,771 nationally) — a middle-class / working-renter tenant base. Strengths: amenities A+, cost of living A+, housing A+; Watch: schools D, crime F.
- Houston ISD (urban): math 27% / reading 35% proficiency, ranked #593 of 826 in TX (top 72%) — families likely to look elsewhere, expect single-tenant / working-renter base with shorter leases; 71% free/reduced lunch — lower-income household profile, screen leases tightly.
- Watch-outs: property tax is 3.6% of price.
- Market conditions: Rents soft (-1.5%/yr); 133 active listings in the ZIP; 4 comparable units currently listed for rent nearby; rentals lingering (median 44d on market — plan ~5-8 weeks vacancy on turnover, expect pricing pressure); 100% of comp listings sitting > 30 days — soft ceiling on asking rent; 29,883 units permitted in Harris County in 2024 (8,621 in 5+ unit buildings).
- Harris County population projected at +47% by 2050 — long-run rental-demand tailwind backs the buy-and-hold thesis.
- 3 sale attempts; this cycle's ask is 21% above the opening price — seller raised mid-cycle; expect resistance to lowballs.
- Climate carrying-cost: severe wind risk, 99% chance of damaging wind over 30y; extreme-heat days projected 7→23/yr by 2055 (HVAC capex compounding) — expect insurance premiums to compound above CPI over the hold.
- Cap rate 6.0% vs local median 3.2% in Houston — top-decile yield for the area; either an underpriced asset or a hidden risk that comps aren't pricing in. Stress-test before assuming the spread holds.
- At $2,622/mo this rent would consume 58% of the median local household income ($54k/yr) (locally 1242% of renters already pay >50% of income on rent) — very limited rent-growth headroom before tenants either downsize or default.
Questions for listing agent
- What do current leases actually rent for vs. the listed asking? Can we see a recent rent roll and the last 12 months of T-12 income?
- It's been on market 122 days. Have you received any prior offers? Is the seller open to a 12% concession, seller financing, or rate buy-down credit?
- Built in 1962 — when were the roof, HVAC, electrical panel, plumbing, and water heater last replaced?
- Property tax is high relative to price — has the assessment been appealed recently, and will the sale trigger a re-assessment?
- What does the HOA fee cover, when was the last increase, and are there any pending special assessments or reserve-fund shortfalls?
- Why hasn't it sold? Are there any deal-killer items the seller is aware of (foundation, flood, title, zoning, code violations)?
- Is there a deadline driving the sale (1031 exchange, divorce, estate, relocation)? That informs how much negotiation room exists.
- Schools are D-rated, which usually means shorter tenancies and higher turnover. Who's the typical renter profile here, and what's been the actual vacancy rate?
CashFlowRE · CFR-RWFMKPAP697Q13
· Data 1 week ago
cashflowre.app · 2026-05-29