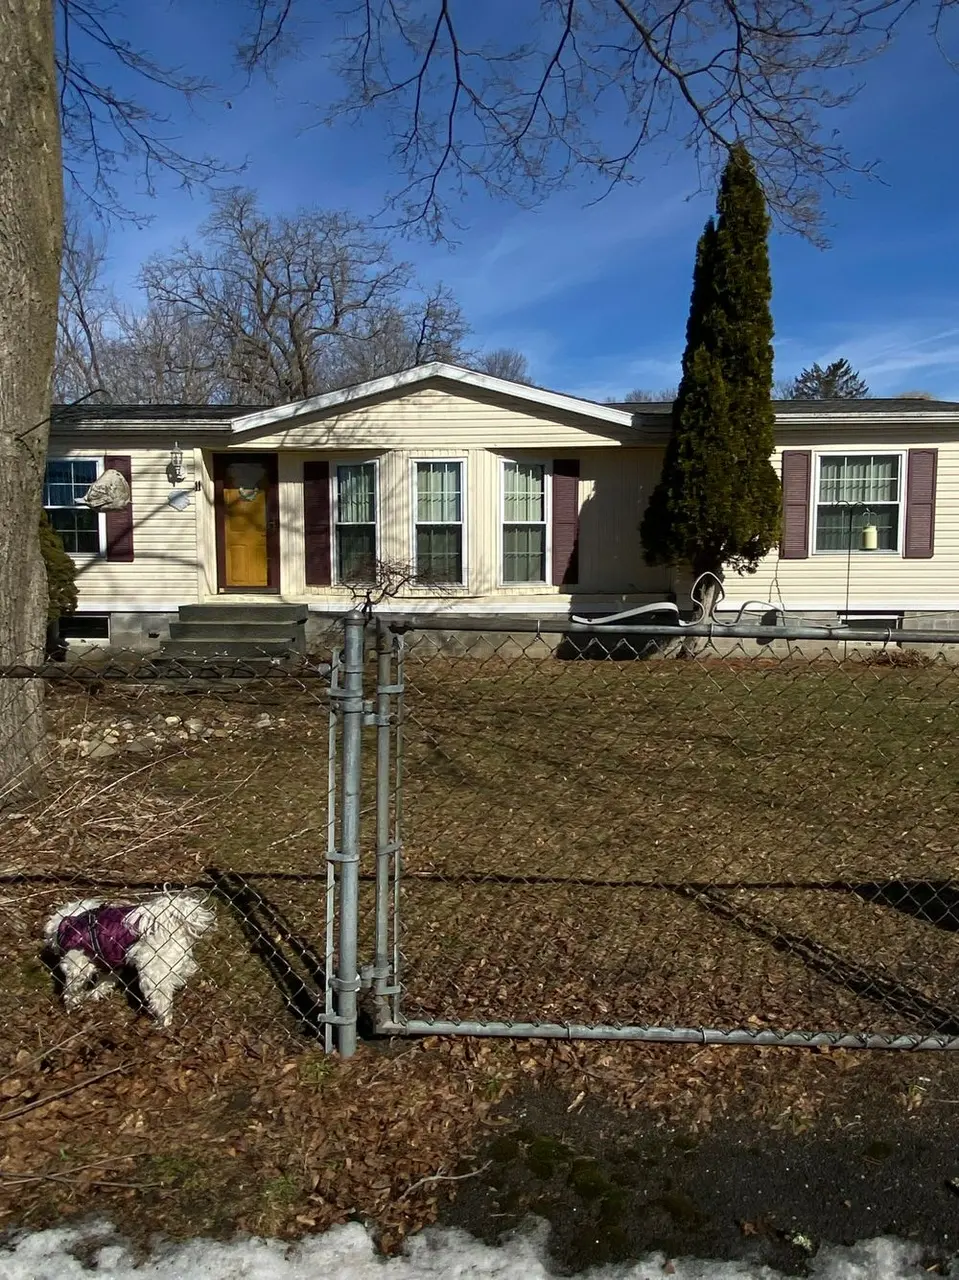
11 East St
Schaghticoke, NY 12154
$234,900D
3 bd · 2.0 ba ·
1,344 sqft ·
Built 1991
· SingleFamily
· Pending
· 24 DOM
Cashflow @ list (25.0% down · 7.5%)
Estimated rent
$1,389/mo
Mortgage (P&I)
−$1,232
Tax + insurance
−$392
HOA
−$0
Vac / Maint / Mgmt
−$292
Net cashflow
$-526/mo
Annual
$-6,314/yr
Cap rate
3.60%
Cash-on-cash
-9.60%
DSCR
0.57
1% rule
0.59%
Cash to close
$65,772
Investor read
- This is a 3-bed/2.0-bath single-family listed at $235k.
- At list price, monthly cash flow is $-526 ($-6k/yr) — negative.
- To cash-flow at today's rent, offer at most $159k (32.4% below list).
- To meet the 1% rule (rent ≥ 1% of price), the offer needs to be $139k (40.9% below list).
- It's been on market 24 days — a 2% lower offer ($231k) is reasonable based on typical stale-listing flexibility.
- Recommended offer: $139k (40.9% below list) — sets the bar for 1% rule.
- In year one you build about $22k of equity ($2k loan paydown + $20k appreciation (8.5% local appreciation)).
- Location reads 63/100 on livability (#813 in NY) — a middle-class / working-renter tenant base. Strengths: housing A+, health & safety A, cost of living B+; Watch: employment C-, crime F, amenities F.
- Hoosic Valley Central School District (rural): math 53% / reading 54% proficiency, ranked #304 of 590 in NY (top 52%) — acceptable for families but not a draw, mixed tenant base, ~2y average lease.
- Zoned schools: Hoosic Valley Elementary School (math 47% / reading 57%, grade C-, #988 of 2,108 statewide, top 49%, 459 students, 0% FRL); Hoosic Valley Junior Senior High School (math 62% / reading 52%, grade C, #887 of 1,100 statewide, top 82%, 397 students, 0% FRL) — zoned schools average 0% FRL vs 21% district-wide (21 pts lower); this property's tenant base skews higher-income than the district average.
- Market conditions: 16 active listings in the ZIP; 405 units permitted in Rensselaer County in 2024 (224 in 5+ unit buildings).
- Rensselaer County population projected to shrink 6% by 2050 — rents likely to lag national; underwrite the cash flow, not the appreciation.
- 2 sale attempts since 29y ago with the ask held roughly flat each time — persistent listings suggest the price (not the market) is what's stuck; bring a comps-based counter.
- Current owner paid $57k; list at $235k implies a 312% gain — meaningful room to come down on a strong offer.
- By year 2, paydown + projected appreciation supports a ~$35k cash-out refi (75% LTV) — recoverable capital for the next deal without selling this one.
Questions for listing agent
- What do current leases actually rent for vs. the listed asking? Can we see a recent rent roll and the last 12 months of T-12 income?
- Is there a deadline driving the sale (1031 exchange, divorce, estate, relocation)? That informs how much negotiation room exists.
- Crime grade is F in this area — have there been break-ins, vandalism, or insurance claims at this property in the last 3 years? What carrier currently insures it and at what premium?
- The area grade is low — what's the realistic commute time and amenity access for the typical tenant pool here? Any planned neighborhood developments (good or bad) we should know about?
- What's the average days-on-market for RENTAL listings here right now (not sales)? A rising rental-DOM trend means longer vacancies and softer asking-rent achievability than the comps imply.
- What's the recent tenant-quality profile in this submarket — average credit score on applications, eviction rate, late-payment / NSF rate, and stable-employment percentage? A property-management company in the area should have these aggregated.
- How much new for-sale + rental construction is in the pipeline within 1–3 miles? Heavy new supply typically softens prices + rents 12–24 months out; constrained supply supports both.
CashFlowRE · CFR-RXG3VP391RT5A9
· Data 2 days ago
cashflowre.app · 2026-05-29