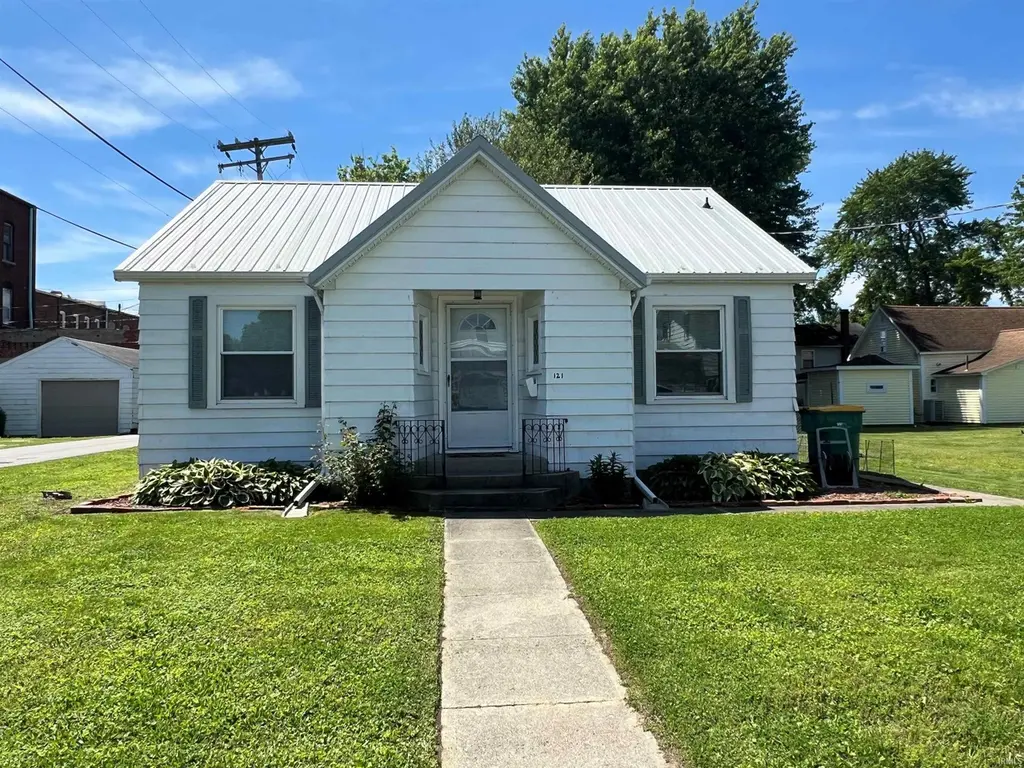
121 W Grant St
Greentown, IN 46936
$109,900B-
2 bd · 1.0 ba ·
798 sqft ·
Built 1946
· SingleFamily
· Pending
· 4 DOM
Cashflow @ list (25.0% down · 7.5%)
Estimated rent
$1,272/mo
Mortgage (P&I)
−$576
Tax + insurance
−$159
HOA
−$0
Vac / Maint / Mgmt
−$267
Net cashflow
$269/mo
Annual
$3,234/yr
Cap rate
9.24%
Cash-on-cash
10.51%
DSCR
1.47
1% rule
1.16%
Cash to close
$30,772
Investor read
- This is a 2-bed/1.0-bath single-family listed at $110k.
- At list price, monthly cash flow is $269 ($3k/yr) — positive.
- The deal already cash-flows at list — no discount required.
- Meets the 1% rule at list price ($1k rent vs $110k).
- Only 4 days on market — expect competitive offers; lowballing is unlikely to land.
- Local home prices are declining (-3.0%/yr); year-one equity from $760 of loan paydown is wiped out by about $3k of value loss. Plan a longer hold.
- Location reads 67/100 on livability (#243 in IN) — a middle-class / working-renter tenant base. Strengths: crime A+, cost of living A+, housing A+; Watch: amenities F, commute F, health & safety D-.
- Eastern Howard School Corporation (town): math 40% / reading 47% proficiency, ranked #100 of 301 in IN (top 33%) — families likely to look elsewhere, expect single-tenant / working-renter base with shorter leases.
- Zoned schools: Eastern Elementary School (math 50% / reading 39%, grade F, #379 of 994 statewide, top 41%, 770 students, 45% FRL); Eastern Middle School (math 30% / reading 44%, grade F, #152 of 330 statewide, top 47%, 397 students, 48% FRL); Eastern High School (math 42% / reading 82%, grade B-, #41 of 369 statewide, top 12%, 467 students, 42% FRL) — zoned schools average 45% FRL vs 24% district-wide (20 pts higher); higher-poverty schools than district average — tighter screening recommended.
- Watch-outs: built in 1946 — expect roof / HVAC / electrical / plumbing capex.
- Market conditions: 30 active listings in the ZIP; 194 units permitted in Howard County in 2024 (0 in 5+ unit buildings).
- Howard County population projected at -11% by 2050 — secular population decline; favor cash flow + early exit over multi-decade hold.
- 4 sale attempts since 12y ago with the ask held roughly flat each time — persistent listings suggest the price (not the market) is what's stuck; bring a comps-based counter.
- Current owner paid $69k; list at $110k implies a 59% gain — meaningful room to come down on a strong offer.
- Climate carrying-cost: moderate flood risk — expect insurance premiums to compound above CPI over the hold.
- Cap rate 9.2% vs local median 6.0% in Greentown — top-decile yield for the area; either an underpriced asset or a hidden risk that comps aren't pricing in. Stress-test before assuming the spread holds.
Questions for listing agent
- Built in 1946 — when were the roof, HVAC, electrical panel, plumbing, and water heater last replaced?
- Is there a deadline driving the sale (1031 exchange, divorce, estate, relocation)? That informs how much negotiation room exists.
- What's the average days-on-market for RENTAL listings here right now (not sales)? A rising rental-DOM trend means longer vacancies and softer asking-rent achievability than the comps imply.
- What's the recent tenant-quality profile in this submarket — average credit score on applications, eviction rate, late-payment / NSF rate, and stable-employment percentage? A property-management company in the area should have these aggregated.
- How much new for-sale + rental construction is in the pipeline within 1–3 miles? Heavy new supply typically softens prices + rents 12–24 months out; constrained supply supports both.
CashFlowRE · CFR-RZD9X296CC3J5C
· Data 2 weeks ago
cashflowre.app · 2026-05-29