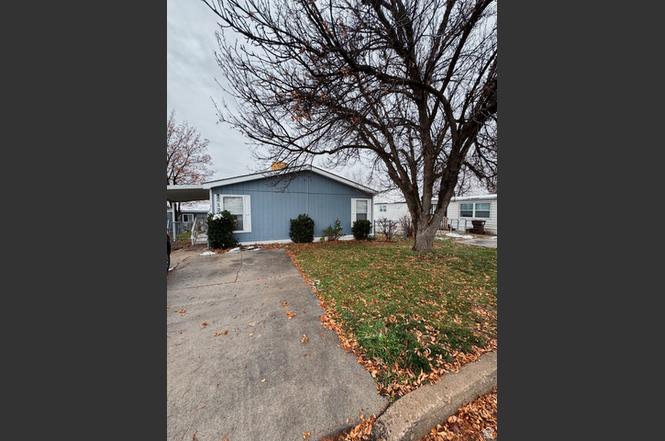
2500 N Fort Ln #212
Layton, UT 84041
$68,500D
3 bd · 1.0 ba ·
972 sqft ·
Built 1995
· Manufactured
· Active
· 129 DOM
Cashflow @ list (25.0% down · 7.5%)
Estimated rent
$1,860/mo
Mortgage (P&I)
−$359
Tax + insurance
−$114
HOA
−$1,050
Vac / Maint / Mgmt
−$391
Net cashflow
$-54/mo
Annual
$-649/yr
Cap rate
5.35%
Cash-on-cash
-3.38%
DSCR
0.85
1% rule
2.72%
Cash to close
$19,180
Investor read
- This is a 3-bed/1.0-bath manufactured listed at $68k.
- At list price, monthly cash flow is $-54 ($-649/yr) — negative.
- To cash-flow at today's rent, offer at most $61k (11.4% below list).
- Meets the 1% rule at list price ($2k rent vs $68k).
- It's been on market 129 days — a 12% lower offer ($60k) is reasonable based on typical stale-listing flexibility.
- Recommended offer: $60k (12.0% below list) — sets the bar for market timing.
- Local home prices are declining (-3.0%/yr); year-one equity from $474 of loan paydown is wiped out by about $2k of value loss. Plan a longer hold.
- Location reads 86/100 on livability (#11 in UT, #457 nationally) — a professional / high-income tenant draw. Strengths: commute A+, employment A+, housing A+.
- Davis District (suburban): math 43% / reading 47% proficiency, ranked #28 of 80 in UT (top 35%) — families likely to look elsewhere, expect single-tenant / working-renter base with shorter leases; only 19% free/reduced lunch — higher-income household profile.
- Zoned schools: Lincoln School (math 13% / reading 16%, grade F, #559 of 585 statewide, top 96%, 703 students, 42% FRL); North Layton Jr High (math 39% / reading 40%, grade F, #75 of 138 statewide, top 56%, 1,009 students, 30% FRL); Northridge High (math 24% / reading 43%, grade F, #106 of 171 statewide, top 62%, 1,954 students, 23% FRL).
- Zoned-school proficiency averages 29% at this address vs 45% district-wide (-16 pts) — the specific schools serving this property underperform the Davis District average; the district grade overstates school quality for this exact location.
- Watch-outs: HOA is 56% of rent.
- Market conditions: Rents rising (+1.3%/yr); 347 active listings in the ZIP; 9 comparable units currently listed for rent nearby; rentals at typical pace (median 16d on market — plan ~3-4 weeks tenant-placement turnaround); solid renter incomes; 1,461 units permitted in Davis County in 2024 (508 in 5+ unit buildings).
- Davis County population projected at +39% by 2050 — long-run rental-demand tailwind backs the buy-and-hold thesis.
- 3 sale attempts since 29y ago; this cycle's ask has dropped $20k (22%) from the opening price — seller is motivated, your offer sets the floor, not the list.
- Climate carrying-cost: moderate wildfire risk — expect insurance premiums to compound above CPI over the hold.
Questions for listing agent
- What do current leases actually rent for vs. the listed asking? Can we see a recent rent roll and the last 12 months of T-12 income?
- It's been on market 129 days. Have you received any prior offers? Is the seller open to a 12% concession, seller financing, or rate buy-down credit?
- What does the HOA fee cover, when was the last increase, and are there any pending special assessments or reserve-fund shortfalls?
- Why hasn't it sold? Are there any deal-killer items the seller is aware of (foundation, flood, title, zoning, code violations)?
- Is there a deadline driving the sale (1031 exchange, divorce, estate, relocation)? That informs how much negotiation room exists.
- Schools are B-rated — typically a magnet for longer-tenancy family renters. What's the average tenant stay here, and is there a school-zone premium baked into asking?
- The area grade is low — what's the realistic commute time and amenity access for the typical tenant pool here? Any planned neighborhood developments (good or bad) we should know about?
- What's the average days-on-market for RENTAL listings here right now (not sales)? A rising rental-DOM trend means longer vacancies and softer asking-rent achievability than the comps imply.
CashFlowRE · CFR-S1A74ZFCY2RY2P
· Data 1 day ago
cashflowre.app · 2026-05-29