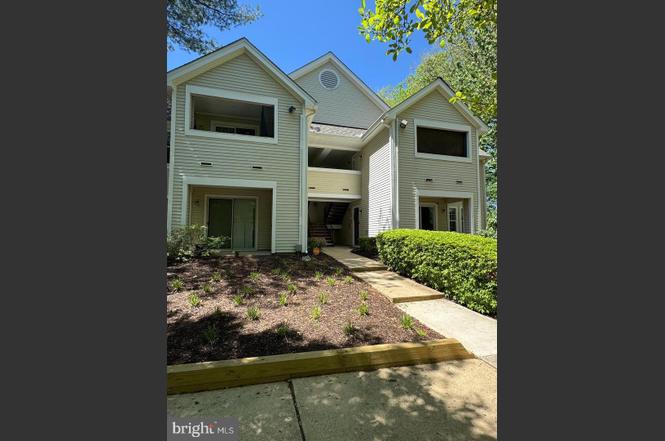
4466 Lord Loudoun Ct Unit 15-3
Marlboro Village, MD 20772
$216,500D
2 bd · 2.0 ba ·
911 sqft ·
Built 1988
· Condo
· Active
· 1 DOM
Cashflow @ list (25.0% down · 7.5%)
Estimated rent
$2,306/mo
Mortgage (P&I)
−$1,135
Tax + insurance
−$308
HOA
−$460
Vac / Maint / Mgmt
−$484
Net cashflow
$-81/mo
Annual
$-970/yr
Cap rate
5.84%
Cash-on-cash
-1.60%
DSCR
0.93
1% rule
1.07%
Cash to close
$60,620
Investor read
- This is a 2-bed/2.0-bath condo listed at $216k.
- At list price, monthly cash flow is $-81 ($-970/yr) — negative.
- To cash-flow at today's rent, offer at most $202k (6.6% below list).
- Meets the 1% rule at list price ($2k rent vs $216k).
- Only 1 days on market — expect competitive offers; lowballing is unlikely to land.
- Recommended offer: $202k (6.6% below list) — sets the bar for cash-flow.
- Local home prices are declining (-3.0%/yr); year-one equity from $1k of loan paydown is wiped out by about $6k of value loss. Plan a longer hold.
- Location reads 66/100 on livability (#226 in MD) — a middle-class / working-renter tenant base. Strengths: employment A+, housing A+; Watch: schools D, cost of living D, amenities F.
- Prince George'S County Public Schools (suburban): math 8% / reading 24% proficiency, ranked #21 of 24 in MD (top 88%) — low school quality limits family demand, transient renter base, plan for 1-2y turnover.
- Market conditions: Rents rising fast (+9.8%/yr); 309 active listings in the ZIP; 7 comparable units currently listed for rent nearby; rentals at typical pace (median 21d on market — plan ~3-4 weeks tenant-placement turnaround); 43% of comp listings sitting > 30 days — soft ceiling on asking rent; high-income renter base; 1,481 units permitted in Prince George's County in 2024 (0 in 5+ unit buildings).
- Prince George's County population projected at +18% by 2050 — long-run rental-demand tailwind backs the buy-and-hold thesis.
- 8 sale attempts since 23y ago with the ask held roughly flat each time — persistent listings suggest the price (not the market) is what's stuck; bring a comps-based counter.
- Climate carrying-cost: moderate wind risk, 25% chance of damaging wind over 30y; extreme-heat days projected 7→17/yr by 2055 (HVAC capex compounding) — expect insurance premiums to compound above CPI over the hold.
- Cap rate 5.8% vs local median 4.8% in Marlboro Village — meaningfully above typical; check what's discounted (condition, days-on-market, listing class) to confirm the premium yield is real.
Questions for listing agent
- What do current leases actually rent for vs. the listed asking? Can we see a recent rent roll and the last 12 months of T-12 income?
- What does the HOA fee cover, when was the last increase, and are there any pending special assessments or reserve-fund shortfalls?
- Any open or pending special assessments — roof, HVAC, plumbing, elevator, façade? What's the per-unit balance and payoff schedule, and is the seller paying it off at close or rolling it to the buyer?
- Is there a deadline driving the sale (1031 exchange, divorce, estate, relocation)? That informs how much negotiation room exists.
- Schools are D-rated, which usually means shorter tenancies and higher turnover. Who's the typical renter profile here, and what's been the actual vacancy rate?
- The area grade is low — what's the realistic commute time and amenity access for the typical tenant pool here? Any planned neighborhood developments (good or bad) we should know about?
- What's the average days-on-market for RENTAL listings here right now (not sales)? A rising rental-DOM trend means longer vacancies and softer asking-rent achievability than the comps imply.
- What's the recent tenant-quality profile in this submarket — average credit score on applications, eviction rate, late-payment / NSF rate, and stable-employment percentage? A property-management company in the area should have these aggregated.
CashFlowRE · CFR-S2D2NK3T1AWJQS
· Data 3 days ago
cashflowre.app · 2026-05-29